> ## Documentation Index
> Fetch the complete documentation index at: https://docs.reelevant.com/llms.txt
> Use this file to discover all available pages before exploring further.
# Overview
> Visualize your campaign data with pre-built dashboards and filters
 ## Overview
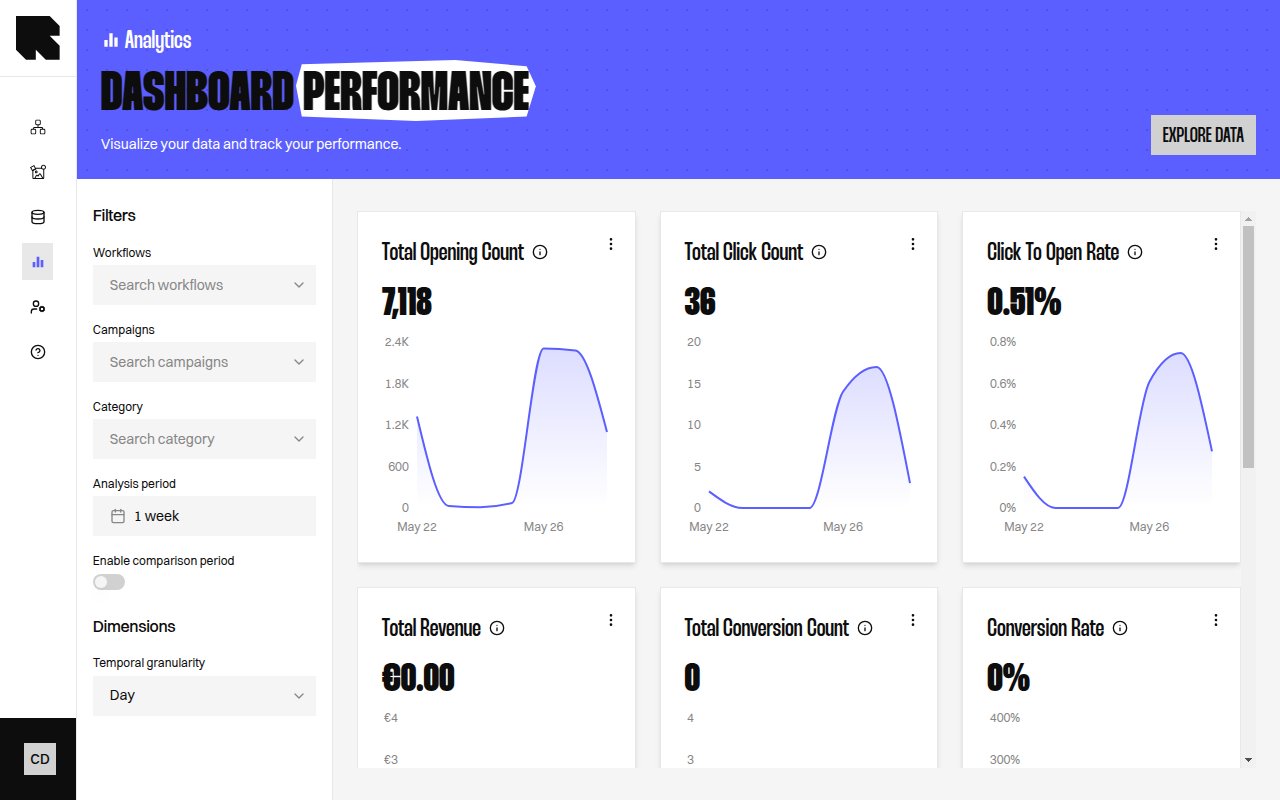
The Dashboards page provides pre-built visualizations for your campaign data. Each dashboard focuses on a specific aspect of performance and can be filtered by workflow, campaign, branch category, and date range.
## Dashboard Filters
All dashboards share a common filter bar at the top:
| Filter | Description |
| --------------------- | --------------------------------------------------------------------- |
| **Workflows** | Select one or more workflows to filter data. Search by workflow name. |
| **Campaigns** | Filter by campaign. |
| **Category** | Filter by branch category. |
| **Analysis period** | Select the date range for the data. |
| **Comparison period** | Optionally enable a comparison period with a custom start date. |
Click **Explore data** to open the [Data Exploration](/product-guide/analytics/data-exploration) page with the current filters pre-applied.
## Available Dashboards
Impressions, clicks, CTR, and content generation metrics.
Unique visitors, openers, clickers, and engagement rates.
Personalization lift — individualized vs. default content metrics.
Conversion tracking, revenue, and attribution metrics.
Incremental value from personalization — click, conversion, and revenue uplift.
Subscription consumption — openings, quota, and usage by team.
## Overview
The Dashboards page provides pre-built visualizations for your campaign data. Each dashboard focuses on a specific aspect of performance and can be filtered by workflow, campaign, branch category, and date range.
## Dashboard Filters
All dashboards share a common filter bar at the top:
| Filter | Description |
| --------------------- | --------------------------------------------------------------------- |
| **Workflows** | Select one or more workflows to filter data. Search by workflow name. |
| **Campaigns** | Filter by campaign. |
| **Category** | Filter by branch category. |
| **Analysis period** | Select the date range for the data. |
| **Comparison period** | Optionally enable a comparison period with a custom start date. |
Click **Explore data** to open the [Data Exploration](/product-guide/analytics/data-exploration) page with the current filters pre-applied.
## Available Dashboards
Impressions, clicks, CTR, and content generation metrics.
Unique visitors, openers, clickers, and engagement rates.
Personalization lift — individualized vs. default content metrics.
Conversion tracking, revenue, and attribution metrics.
Incremental value from personalization — click, conversion, and revenue uplift.
Subscription consumption — openings, quota, and usage by team.