> ## Documentation Index
> Fetch the complete documentation index at: https://docs.reelevant.com/llms.txt
> Use this file to discover all available pages before exploring further.
# Conversions Dashboard
> Track conversions, revenue, and attribution metrics from your campaigns
 ## Overview
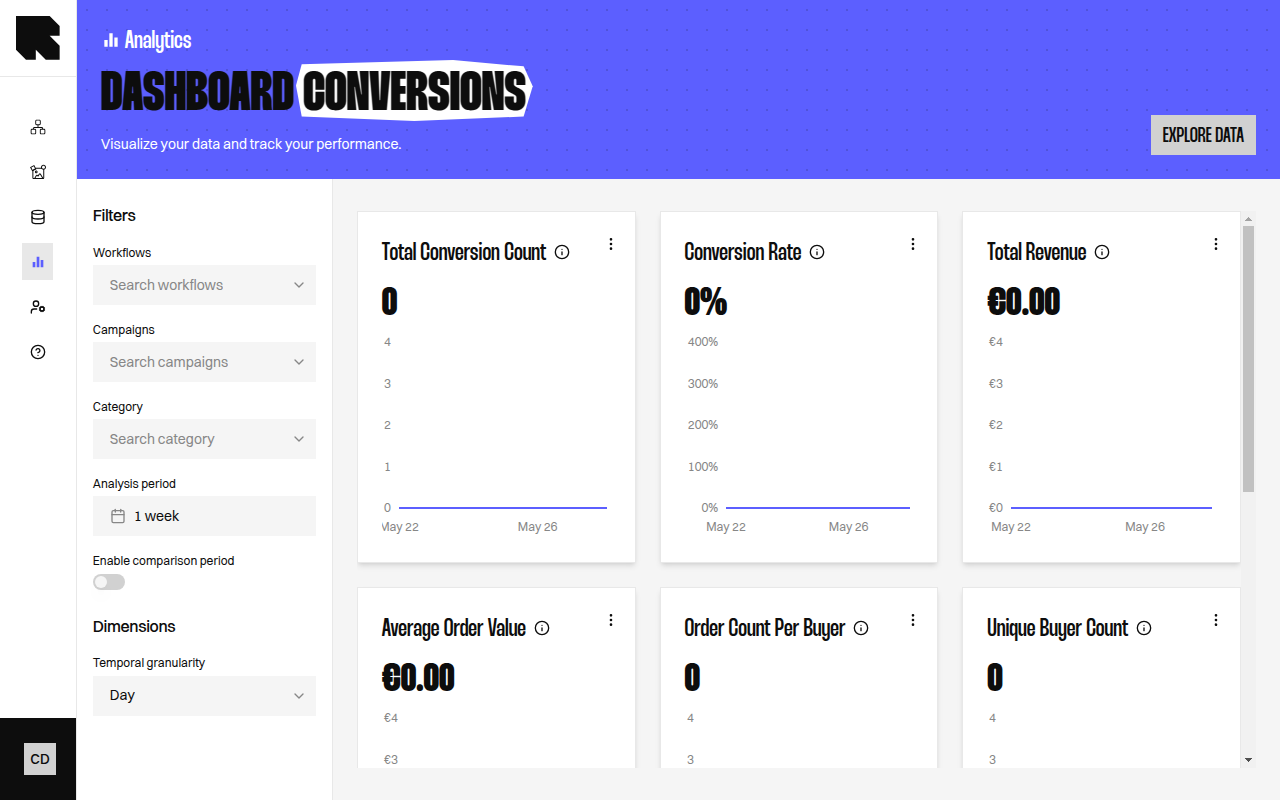
The Conversions dashboard tracks the business outcomes of your campaigns — purchases, revenue, and buyer behavior attributed to Reelevant content interactions.
## Key Metrics
| Metric | Description |
| -------------------------------------- | ------------------------------------------------------------------------------------------------------- |
| **Total Conversion Count** | Number of conversions that followed a click on a Reelevant content. |
| **Unique Buyer Count** | Number of different people that have purchased at least once. |
| **Influenced Revenue** | Revenue credited to Reelevant content interactions, spread across the interactions before the purchase. |
| **Direct Revenue** | Revenue credited only to the last Reelevant interaction before the purchase. |
| **Total Revenue** | Revenue generated by conversions. |
| **Average Order Value** | Average order value for the conversions. |
| **Average Revenue Per Buyer** | Average revenue generated per buyer. |
| **Order Count Per Buyer** | Average number of purchases per buyer. |
| **Time To Purchase From Click** | Average time between a click on Reelevant content and the purchase. |
| **Reference Count** | Total number of product references in the transactions. |
| **Average Reference Count Per Basket** | Average number of product references per transaction. |
| **Conversion Rate** | Conversions per clicks. |
| **Unique Conversion Rate** | Conversion rate for unique individuals. |
## How Attribution Works
Reelevant credits each conversion to the content interactions that led to it. Credit is shared across those interactions using your chosen **attribution model**, within a **lookback window** for each interaction type. Configure both in [Analytics Settings](/product-guide/analytics/settings).
**Influenced Revenue** spreads credit across every qualifying interaction, while **Direct Revenue** credits only the last one. Comparing them shows how much your earlier interactions contribute. See [Attribution](/product-guide/analytics/attribution) for the full explanation.
## Overview
The Conversions dashboard tracks the business outcomes of your campaigns — purchases, revenue, and buyer behavior attributed to Reelevant content interactions.
## Key Metrics
| Metric | Description |
| -------------------------------------- | ------------------------------------------------------------------------------------------------------- |
| **Total Conversion Count** | Number of conversions that followed a click on a Reelevant content. |
| **Unique Buyer Count** | Number of different people that have purchased at least once. |
| **Influenced Revenue** | Revenue credited to Reelevant content interactions, spread across the interactions before the purchase. |
| **Direct Revenue** | Revenue credited only to the last Reelevant interaction before the purchase. |
| **Total Revenue** | Revenue generated by conversions. |
| **Average Order Value** | Average order value for the conversions. |
| **Average Revenue Per Buyer** | Average revenue generated per buyer. |
| **Order Count Per Buyer** | Average number of purchases per buyer. |
| **Time To Purchase From Click** | Average time between a click on Reelevant content and the purchase. |
| **Reference Count** | Total number of product references in the transactions. |
| **Average Reference Count Per Basket** | Average number of product references per transaction. |
| **Conversion Rate** | Conversions per clicks. |
| **Unique Conversion Rate** | Conversion rate for unique individuals. |
## How Attribution Works
Reelevant credits each conversion to the content interactions that led to it. Credit is shared across those interactions using your chosen **attribution model**, within a **lookback window** for each interaction type. Configure both in [Analytics Settings](/product-guide/analytics/settings).
**Influenced Revenue** spreads credit across every qualifying interaction, while **Direct Revenue** credits only the last one. Comparing them shows how much your earlier interactions contribute. See [Attribution](/product-guide/analytics/attribution) for the full explanation.