> ## Documentation Index
> Fetch the complete documentation index at: https://docs.reelevant.com/llms.txt
> Use this file to discover all available pages before exploring further.
# Analytics Overview
> Measure campaign performance with dashboards, data exploration, and saved queries
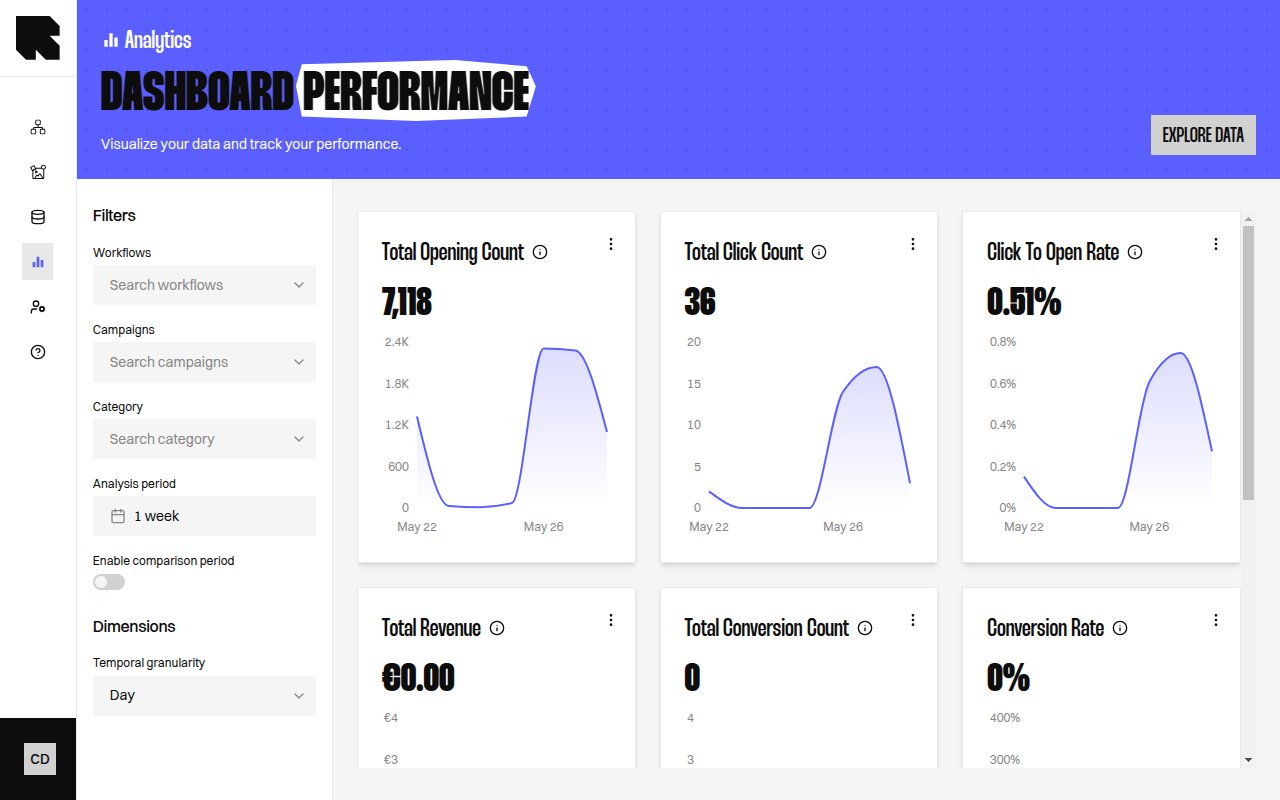 ## What is Analytics?
Analytics is the Reelevant platform's measurement and insights center. It provides pre-built dashboards for tracking campaign performance, a flexible data exploration tool for custom analysis, and saved queries for recurring reports.
## Key Concepts
| Concept | Description |
| -------------------------- | --------------------------------------------------------------------------------------------------------------------------------------------------------------------- |
| **Dashboard** | A pre-built view showing key metrics for a specific aspect of your campaigns (performance, audience, conversions, etc.). |
| **Measure** | A quantitative metric — impressions, clicks, CTR, conversions, revenue, etc. |
| **Dimension** | A qualitative attribute used to group or segment data — workflow name, device type, content name, etc. |
| **Analysis period** | The date range for the data displayed in dashboards and queries. |
| **Attribution** | How Reelevant credits revenue to content interactions, using an [attribution model](/product-guide/analytics/attribution) and a lookback window per interaction type. |
| **Individualized content** | Content delivered through personalized [workflow](/product-guide/workflows/overview) branches, as opposed to default (non-personalized) content. |
| **Uplift** | The incremental value generated by personalization compared to what default content would have achieved. |
## Analytics Sections
Pre-built dashboards for performance, audience, conversions, individualization, uplift, and usage.
Understand influenced revenue and how Reelevant credits content interactions.
Build custom queries with measures, dimensions, and filters.
Review the full analytics reference for measures and dimensions.
Save, schedule, and automate recurring queries with email delivery.
Configure attribution and other analytics settings.
## What is Analytics?
Analytics is the Reelevant platform's measurement and insights center. It provides pre-built dashboards for tracking campaign performance, a flexible data exploration tool for custom analysis, and saved queries for recurring reports.
## Key Concepts
| Concept | Description |
| -------------------------- | --------------------------------------------------------------------------------------------------------------------------------------------------------------------- |
| **Dashboard** | A pre-built view showing key metrics for a specific aspect of your campaigns (performance, audience, conversions, etc.). |
| **Measure** | A quantitative metric — impressions, clicks, CTR, conversions, revenue, etc. |
| **Dimension** | A qualitative attribute used to group or segment data — workflow name, device type, content name, etc. |
| **Analysis period** | The date range for the data displayed in dashboards and queries. |
| **Attribution** | How Reelevant credits revenue to content interactions, using an [attribution model](/product-guide/analytics/attribution) and a lookback window per interaction type. |
| **Individualized content** | Content delivered through personalized [workflow](/product-guide/workflows/overview) branches, as opposed to default (non-personalized) content. |
| **Uplift** | The incremental value generated by personalization compared to what default content would have achieved. |
## Analytics Sections
Pre-built dashboards for performance, audience, conversions, individualization, uplift, and usage.
Understand influenced revenue and how Reelevant credits content interactions.
Build custom queries with measures, dimensions, and filters.
Review the full analytics reference for measures and dimensions.
Save, schedule, and automate recurring queries with email delivery.
Configure attribution and other analytics settings.