> ## Documentation Index
> Fetch the complete documentation index at: https://docs.reelevant.com/llms.txt
> Use this file to discover all available pages before exploring further.
# Track Opener Consumption
> Understand how openings and openers are counted and follow your consumption on the Usage dashboard
 Your Reelevant plan is measured by how much your campaigns are consumed. This page explains what counts as consumption and how to follow it.
## What Counts as Consumption
Reelevant bills your usage on the number of opens your [Workflows](/product-guide/workflows/overview) generate. Depending on your plan, you are counted on openings or on openers.
| Term | What it means |
| ----------- | ----------------------------------------------------------- |
| **Opening** | Each time a Workflow displays Reelevant Content to someone. |
| **Opener** | A unique person who triggered at least one opening. |
One opener can create many openings. If a person opens the same email three times, that is 1 opener and 3 openings.
Your plan counts one of these two:
| Plan type | How consumption is counted |
| ----------------- | ----------------------------------------------- |
| **Openings plan** | Every opening adds to your consumption. |
| **Openers plan** | Only the first opening from each person counts. |
## Open the Usage Dashboard
You follow your consumption on the [Usage dashboard](/product-guide/analytics/dashboards/usage), a dedicated page in the Analytics app.
1. Open **Analytics** from the main navigation.
2. Select **Dashboards**.
3. Choose **Usage**.
## Read Your Consumption
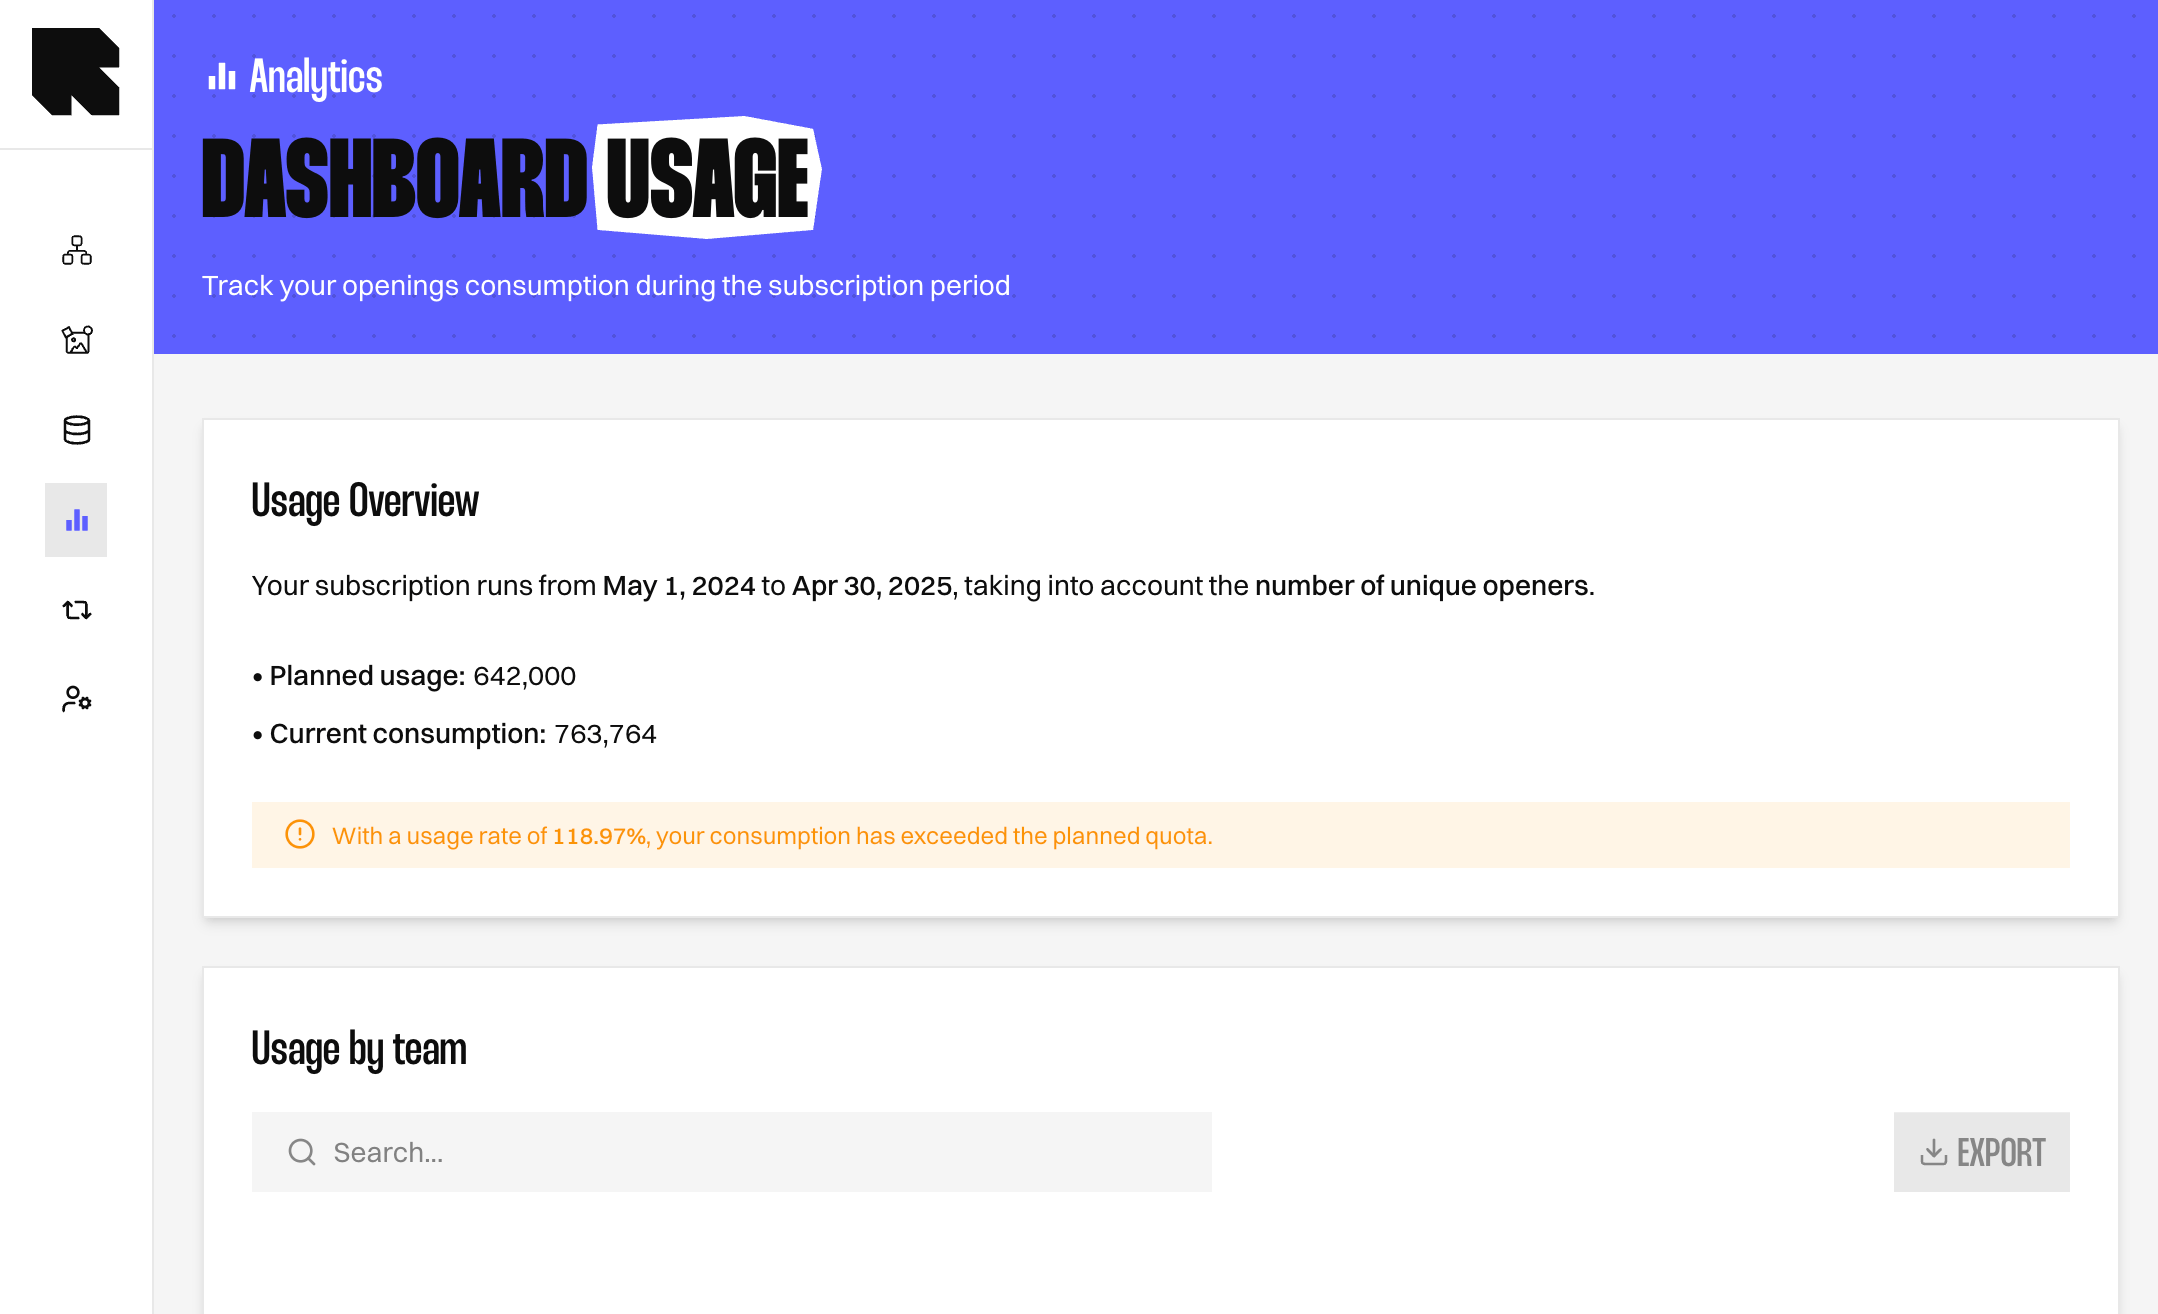
The consumption card at the top shows where you stand for the current period.
| Field | What it tells you |
| ----------------------- | --------------------------------------------------------- |
| **Subscription period** | The start and end dates your plan covers. |
| **Plan type** | Whether you are counted on openings or on unique openers. |
| **Planned usage** | The amount included in your plan. |
| **Current consumption** | How much you have used so far. |
A coloured banner tells you how close you are to your plan limit.
| Status | Meaning |
| ---------- | ---------------------------------------------- |
| **Green** | Your consumption is within the planned amount. |
| **Yellow** | You have gone over the planned amount. |
| **Red** | You have gone well over the planned amount. |
Going over your planned usage can affect your billing. Check the banner regularly so there are no surprises.
## Break Down Your Consumption
Two tables under the card show where your consumption comes from. Each row shows one value, so nothing is grouped together.
| Table | What it shows |
| -------------------- | ---------------------------------------------------------------------------------------------------------------- |
| **Usage by team** | Consumption split by [Team](/product-guide/account/teams). A Workflow shared by two Teams appears once per Team. |
| **Usage by channel** | Consumption split by [Channel](/product-guide/workflows/channels) type. |
Use the team breakdown to see which Teams drive the most consumption. This helps you plan capacity and share budget fairly.
## What's Next?
Review every field on the Usage dashboard in detail.
See how openings and openers are defined in the analytics reference.
Build your own breakdown of consumption with measures and dimensions.
Your Reelevant plan is measured by how much your campaigns are consumed. This page explains what counts as consumption and how to follow it.
## What Counts as Consumption
Reelevant bills your usage on the number of opens your [Workflows](/product-guide/workflows/overview) generate. Depending on your plan, you are counted on openings or on openers.
| Term | What it means |
| ----------- | ----------------------------------------------------------- |
| **Opening** | Each time a Workflow displays Reelevant Content to someone. |
| **Opener** | A unique person who triggered at least one opening. |
One opener can create many openings. If a person opens the same email three times, that is 1 opener and 3 openings.
Your plan counts one of these two:
| Plan type | How consumption is counted |
| ----------------- | ----------------------------------------------- |
| **Openings plan** | Every opening adds to your consumption. |
| **Openers plan** | Only the first opening from each person counts. |
## Open the Usage Dashboard
You follow your consumption on the [Usage dashboard](/product-guide/analytics/dashboards/usage), a dedicated page in the Analytics app.
1. Open **Analytics** from the main navigation.
2. Select **Dashboards**.
3. Choose **Usage**.
## Read Your Consumption
The consumption card at the top shows where you stand for the current period.
| Field | What it tells you |
| ----------------------- | --------------------------------------------------------- |
| **Subscription period** | The start and end dates your plan covers. |
| **Plan type** | Whether you are counted on openings or on unique openers. |
| **Planned usage** | The amount included in your plan. |
| **Current consumption** | How much you have used so far. |
A coloured banner tells you how close you are to your plan limit.
| Status | Meaning |
| ---------- | ---------------------------------------------- |
| **Green** | Your consumption is within the planned amount. |
| **Yellow** | You have gone over the planned amount. |
| **Red** | You have gone well over the planned amount. |
Going over your planned usage can affect your billing. Check the banner regularly so there are no surprises.
## Break Down Your Consumption
Two tables under the card show where your consumption comes from. Each row shows one value, so nothing is grouped together.
| Table | What it shows |
| -------------------- | ---------------------------------------------------------------------------------------------------------------- |
| **Usage by team** | Consumption split by [Team](/product-guide/account/teams). A Workflow shared by two Teams appears once per Team. |
| **Usage by channel** | Consumption split by [Channel](/product-guide/workflows/channels) type. |
Use the team breakdown to see which Teams drive the most consumption. This helps you plan capacity and share budget fairly.
## What's Next?
Review every field on the Usage dashboard in detail.
See how openings and openers are defined in the analytics reference.
Build your own breakdown of consumption with measures and dimensions.