> ## Documentation Index
> Fetch the complete documentation index at: https://docs.reelevant.com/llms.txt
> Use this file to discover all available pages before exploring further.
# Datagraph
> Connect your Datasources into a single data model so Workflows can reuse the same trusted data
The Datagraph is the part of the [DataHub](/product-guide/datahub/overview) where you describe how your Datasources relate to each other. It lets your Workflows reuse the same trusted data.
The Datagraph is in beta. Its pages and options can still change. Talk to your Technical Account Manager before you rely on it in a live Workflow.
## Why Use the Datagraph?
Each Datasource holds one set of data — products, stores, purchases, or customers. On its own, a Datasource cannot answer a question that needs two sets of data at once.
The Datagraph links Datasources together. Once linked, your data team can prepare reusable Entities (saved questions such as "top five products bought by this person") that any Workflow can reuse.
You do not have to build the Datagraph yourself. It is usually set up once by your data team or your Reelevant Technical Account Manager, then reused by everyone.
## Where to Find It
Open **DataHub** in the sidebar, then choose **Datagraph**. You will see three pages:
| Page | What it is for |
| ------------ | ------------------------------------------------------------------------------------- |
| **Schema** | The data model: which Datasources are part of the Datagraph, and how they are linked. |
| **Explorer** | A visual map of that model, with a health check on every link. |
| **Entities** | The reusable questions built on top of the model, ready to be used in Workflows. |
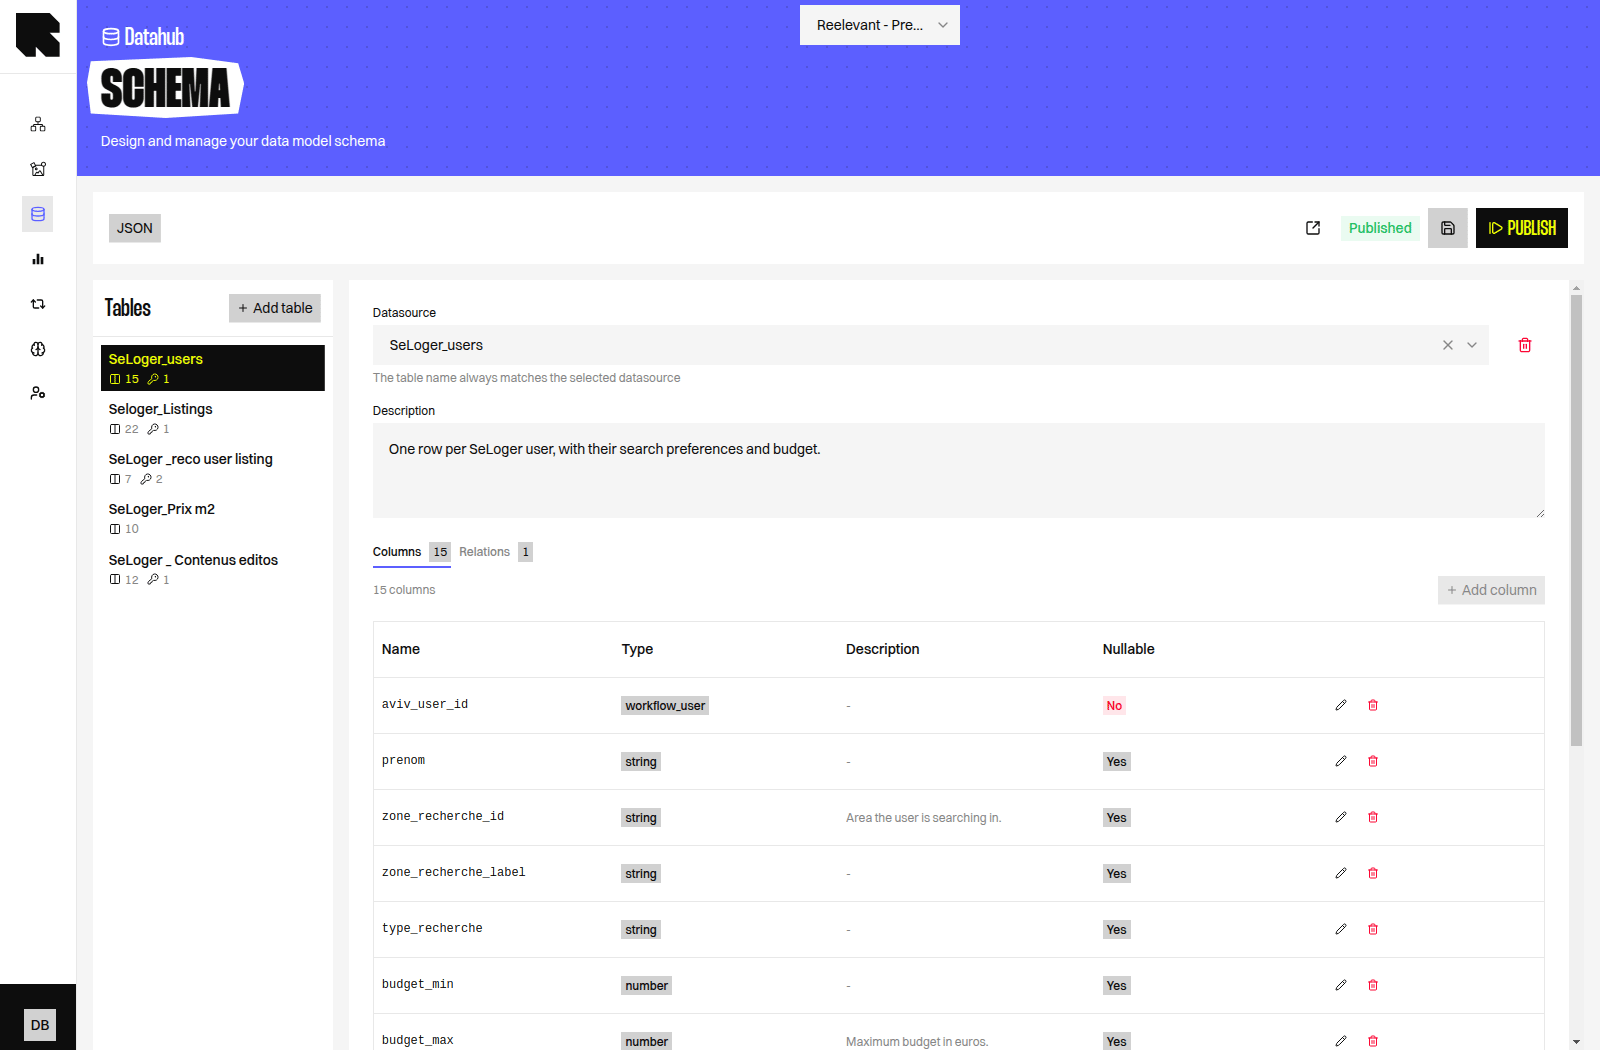
On the **Schema** page, the **Tables** panel on the left lists the Datasources in the model. Selecting a table shows its **Columns** and its **Relations** (the links to other tables).
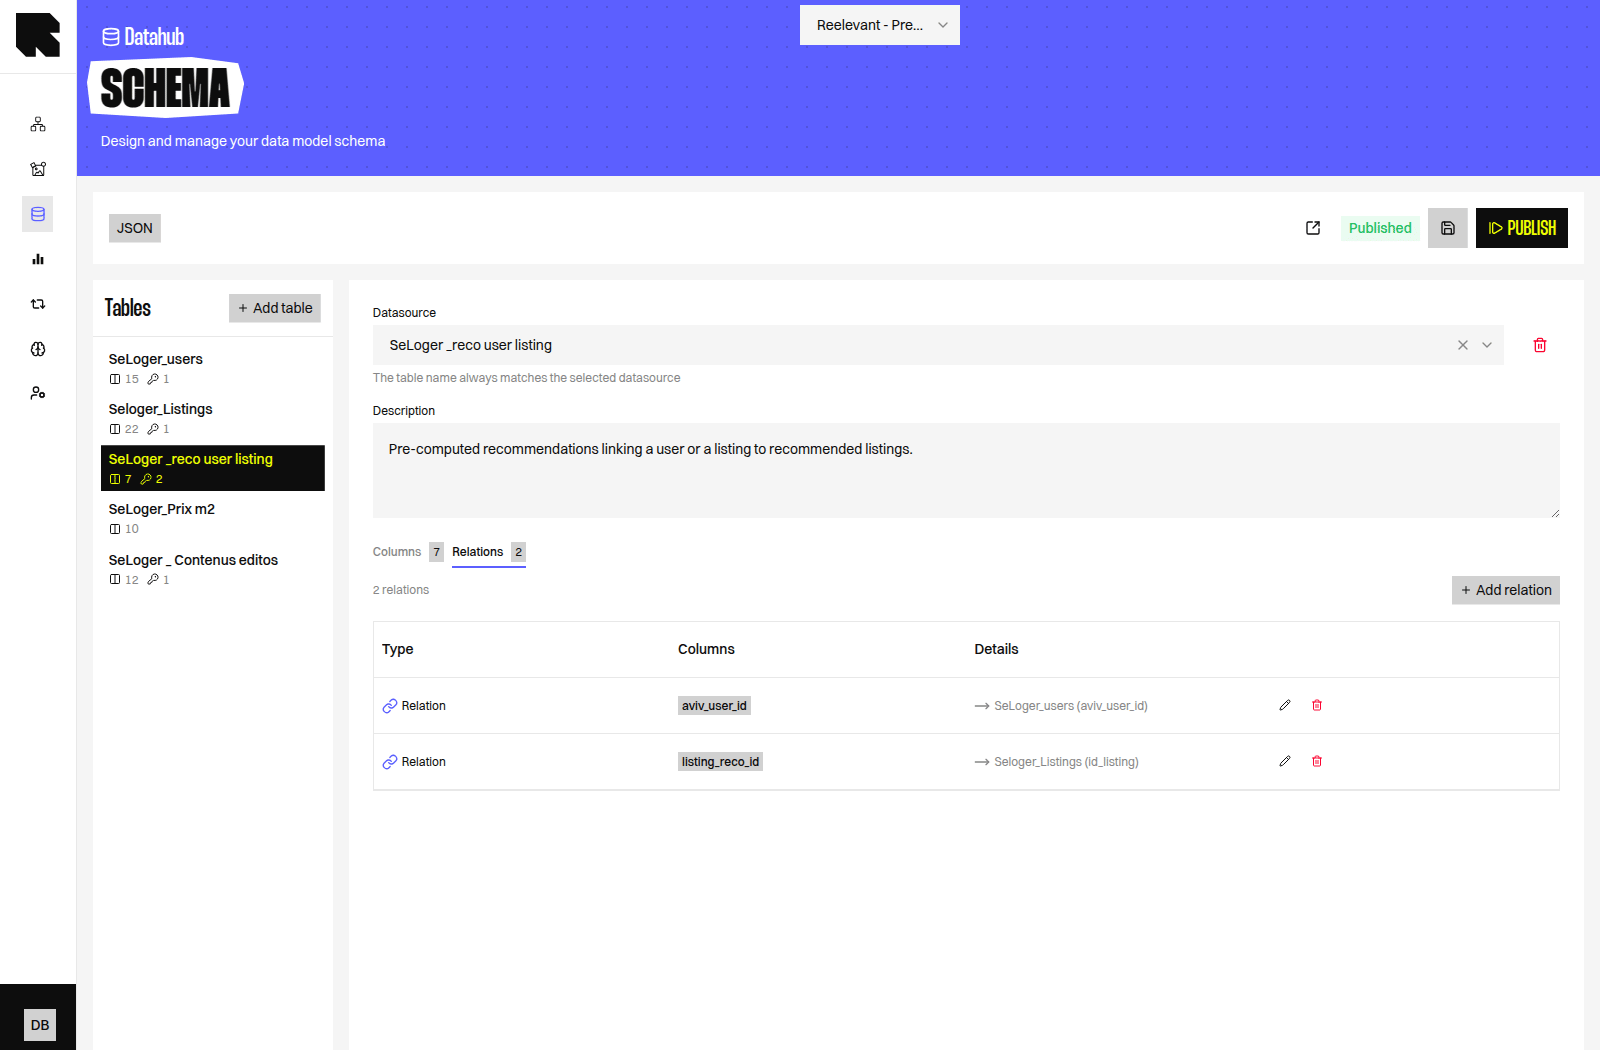
 The **Relations** tab shows which other tables the selected table is linked to, and on which fields.
 ## Understanding the Explorer
The **Explorer** is the most useful page if you simply want to understand your data.
1. Open **DataHub → Datagraph → Explorer**.
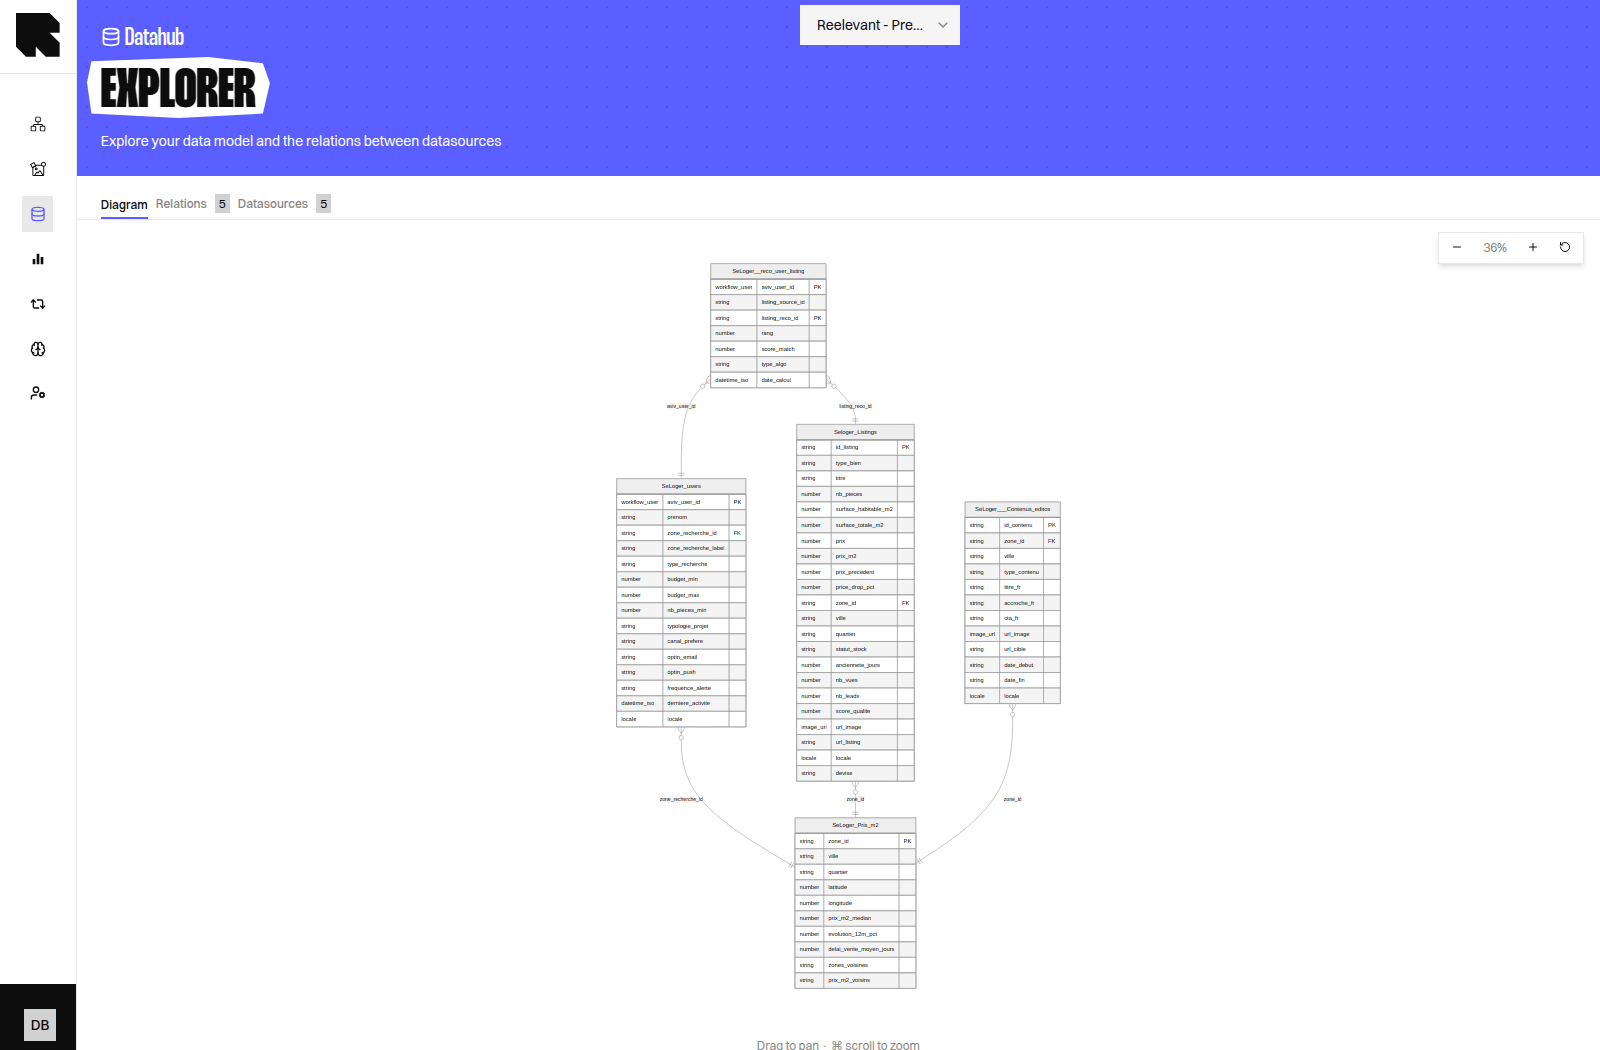
2. Stay on the **Diagram** tab to see every Datasource as a box, with lines showing how they are linked.
3. Drag the diagram to move around, and use the zoom buttons to get closer.
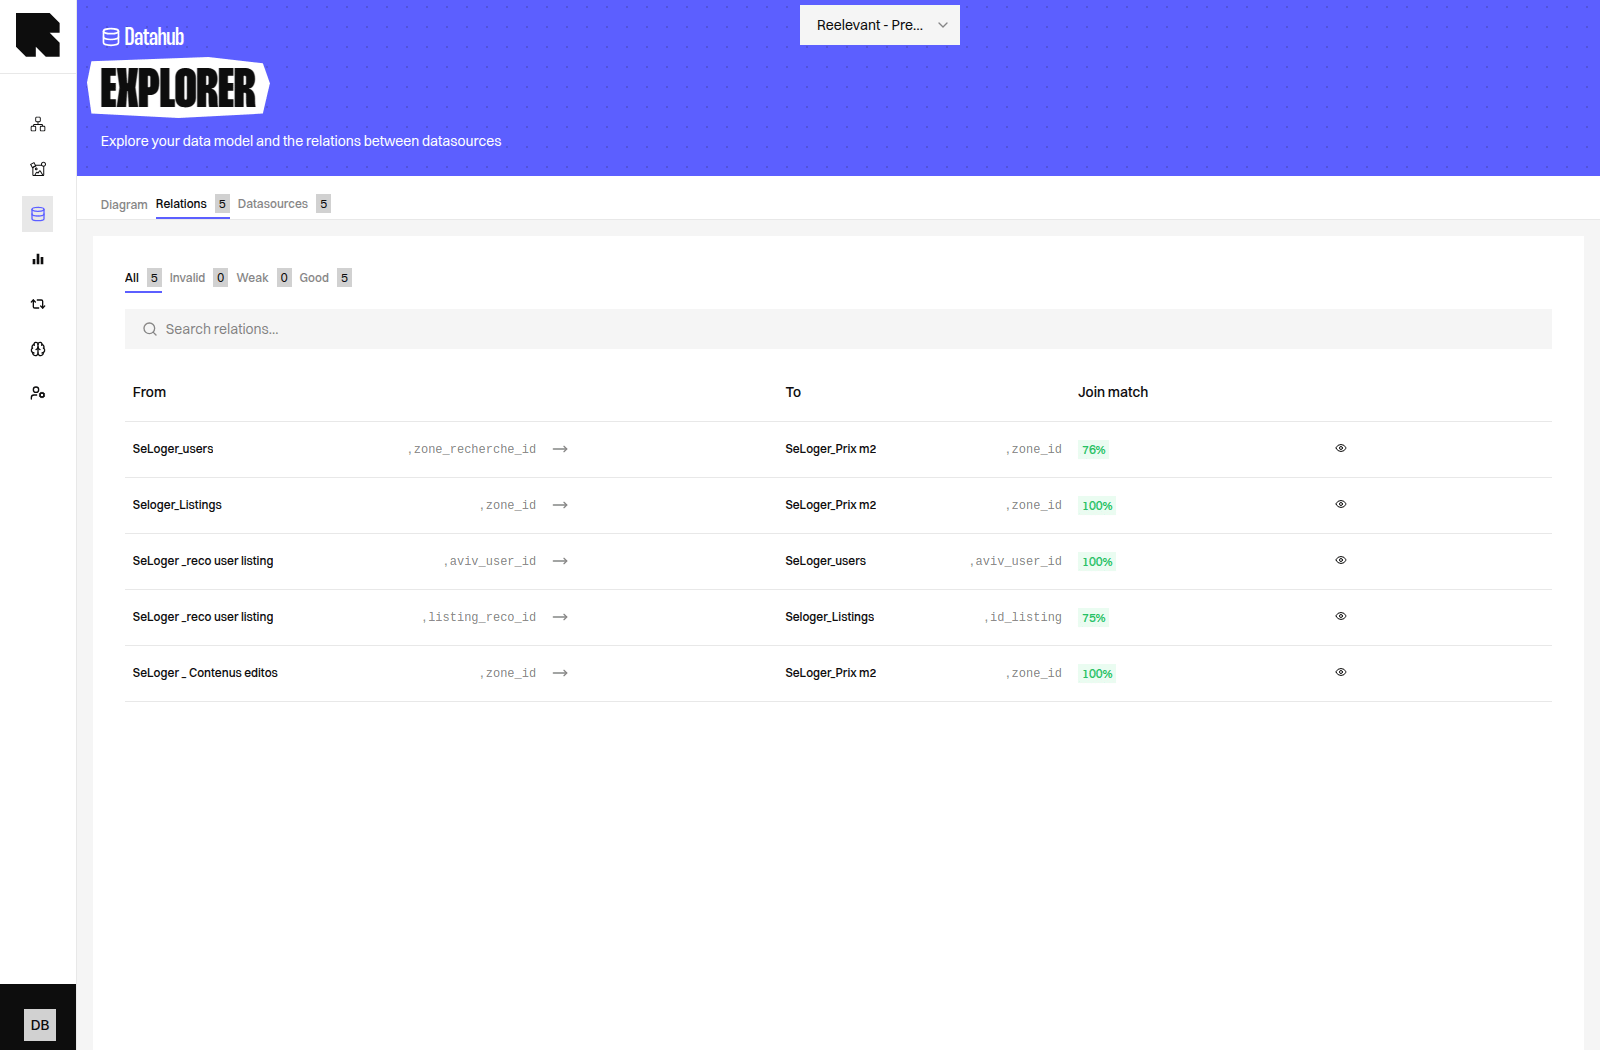
4. Open the **Relations** tab to review each link one by one.
5. Open the **Datasources** tab to list the Datasources used in the model, with their fields.
## Understanding the Explorer
The **Explorer** is the most useful page if you simply want to understand your data.
1. Open **DataHub → Datagraph → Explorer**.
2. Stay on the **Diagram** tab to see every Datasource as a box, with lines showing how they are linked.
3. Drag the diagram to move around, and use the zoom buttons to get closer.
4. Open the **Relations** tab to review each link one by one.
5. Open the **Datasources** tab to list the Datasources used in the model, with their fields.
 If the Explorer asks you to create a Schema first, the Datagraph has not been set up yet. Ask your data team or your Technical Account Manager to build it.
On the **Relations** tab, each link shows a **Join match** percentage. It tells you how well the values on both sides of the link actually overlap in your data.
If the Explorer asks you to create a Schema first, the Datagraph has not been set up yet. Ask your data team or your Technical Account Manager to build it.
On the **Relations** tab, each link shows a **Join match** percentage. It tells you how well the values on both sides of the link actually overlap in your data.
 | Filter | What it shows |
| ----------- | ------------------------------------------------------------ |
| **All** | Every link in the model. |
| **Good** | Links where the values overlap well. |
| **Weak** | Links with a low overlap — worth a look with your data team. |
| **Invalid** | Links that could not be checked at all. |
A weak or invalid link usually means the two Datasources do not share the same identifiers. Personalisation built on that link may return no result, so raise it with your data team before you use it in a Workflow.
## Draft and Published Versions
The **Schema** and each Entity have their own version, shown as a status.
| Status | Meaning |
| --------------------------- | ---------------------------------------------------------- |
| **Draft** | Work in progress. Only visible inside the Datagraph pages. |
| **Published** (or **Live**) | The version Workflows actually use. |
| **Inactive** | A previously published version, kept for history. |
Nothing you see in a Draft affects your live personalisation until someone publishes it.
| Filter | What it shows |
| ----------- | ------------------------------------------------------------ |
| **All** | Every link in the model. |
| **Good** | Links where the values overlap well. |
| **Weak** | Links with a low overlap — worth a look with your data team. |
| **Invalid** | Links that could not be checked at all. |
A weak or invalid link usually means the two Datasources do not share the same identifiers. Personalisation built on that link may return no result, so raise it with your data team before you use it in a Workflow.
## Draft and Published Versions
The **Schema** and each Entity have their own version, shown as a status.
| Status | Meaning |
| --------------------------- | ---------------------------------------------------------- |
| **Draft** | Work in progress. Only visible inside the Datagraph pages. |
| **Published** (or **Live**) | The version Workflows actually use. |
| **Inactive** | A previously published version, kept for history. |
Nothing you see in a Draft affects your live personalisation until someone publishes it.
 ## What Entities Can Answer
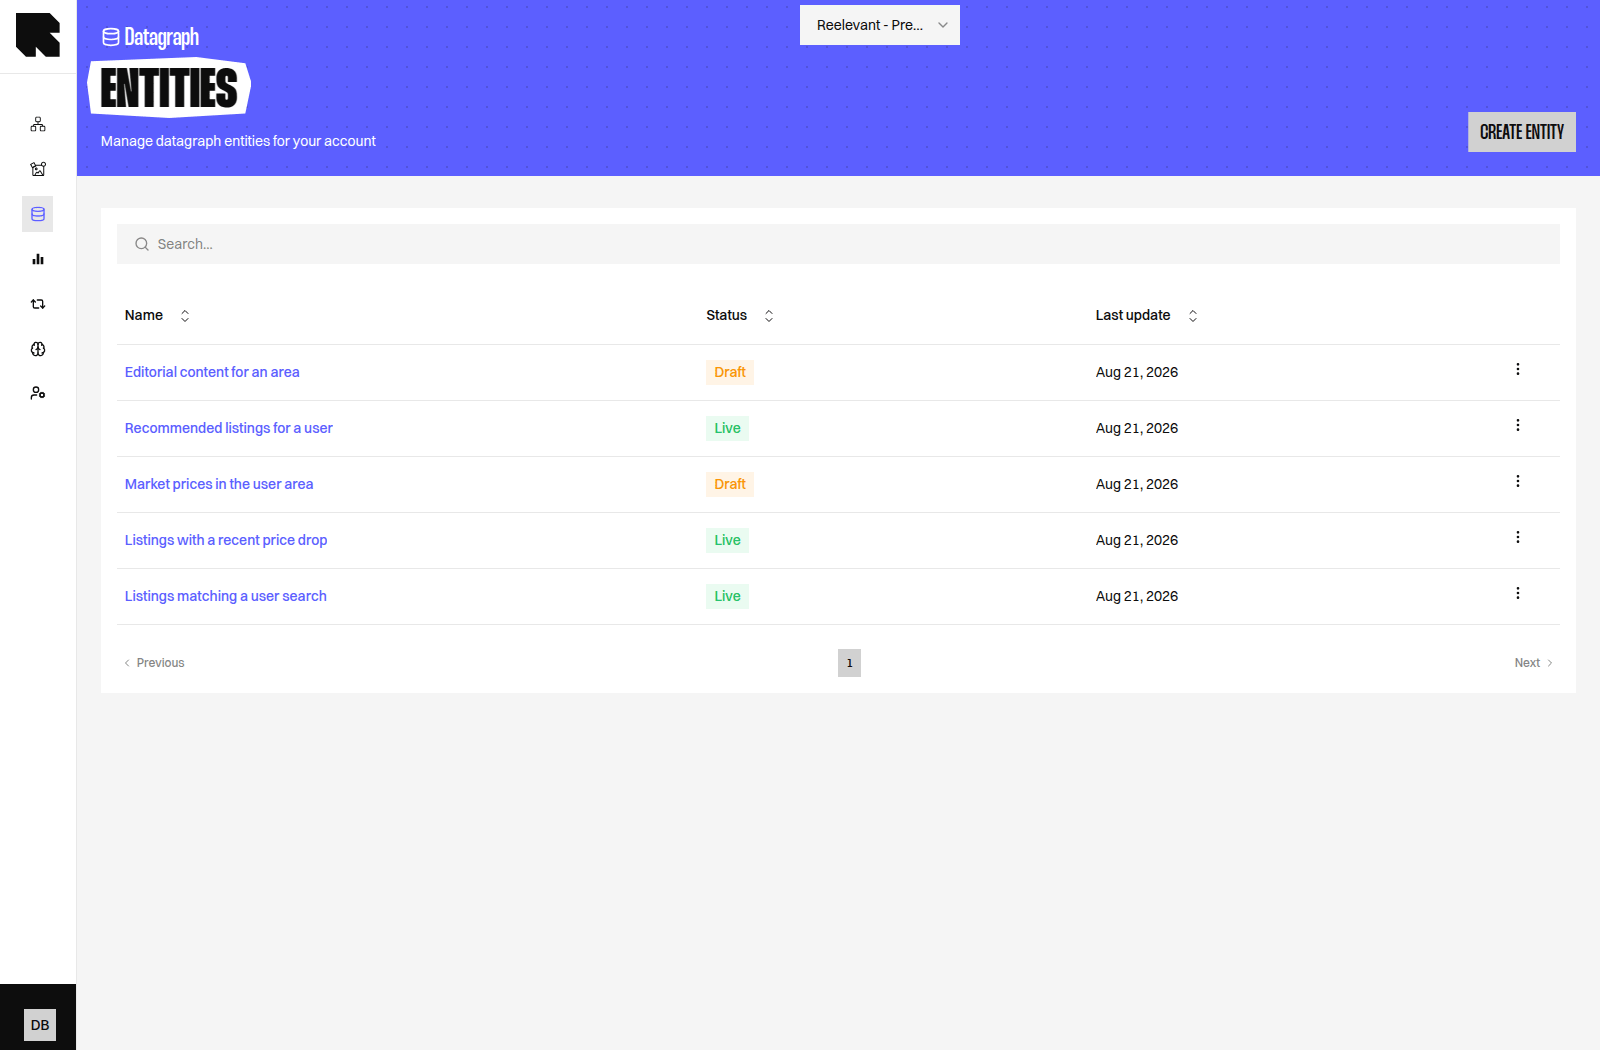
An Entity answers one question about one person, one product, or one area. Your data team writes it once, and every Workflow can reuse it.
Here are typical examples for a property listings account:
| Entity | The question it answers |
| ------------------------------------- | --------------------------------------------------------------------------------------- |
| **Listings matching a user search** | Which listings sit in the area this person is searching, within their budget? |
| **Listings with a recent price drop** | Which listings in an area just became cheaper, biggest drop first? |
| **Market prices in the user area** | What is the median price per square metre and the trend where this person is searching? |
| **Recommended listings for a user** | Which listings does our recommendation data suggest for this person? |
| **Editorial content for an area** | Which guides and market articles are published for this area? |
The same patterns work for other businesses. A retail account might ask for the last items a person bought, the stock left in their favourite store, or the best sellers of their preferred category.
Describe the question you need in plain words, with the data it should return. Your data team turns it into an Entity, then you pick it in your Workflow.
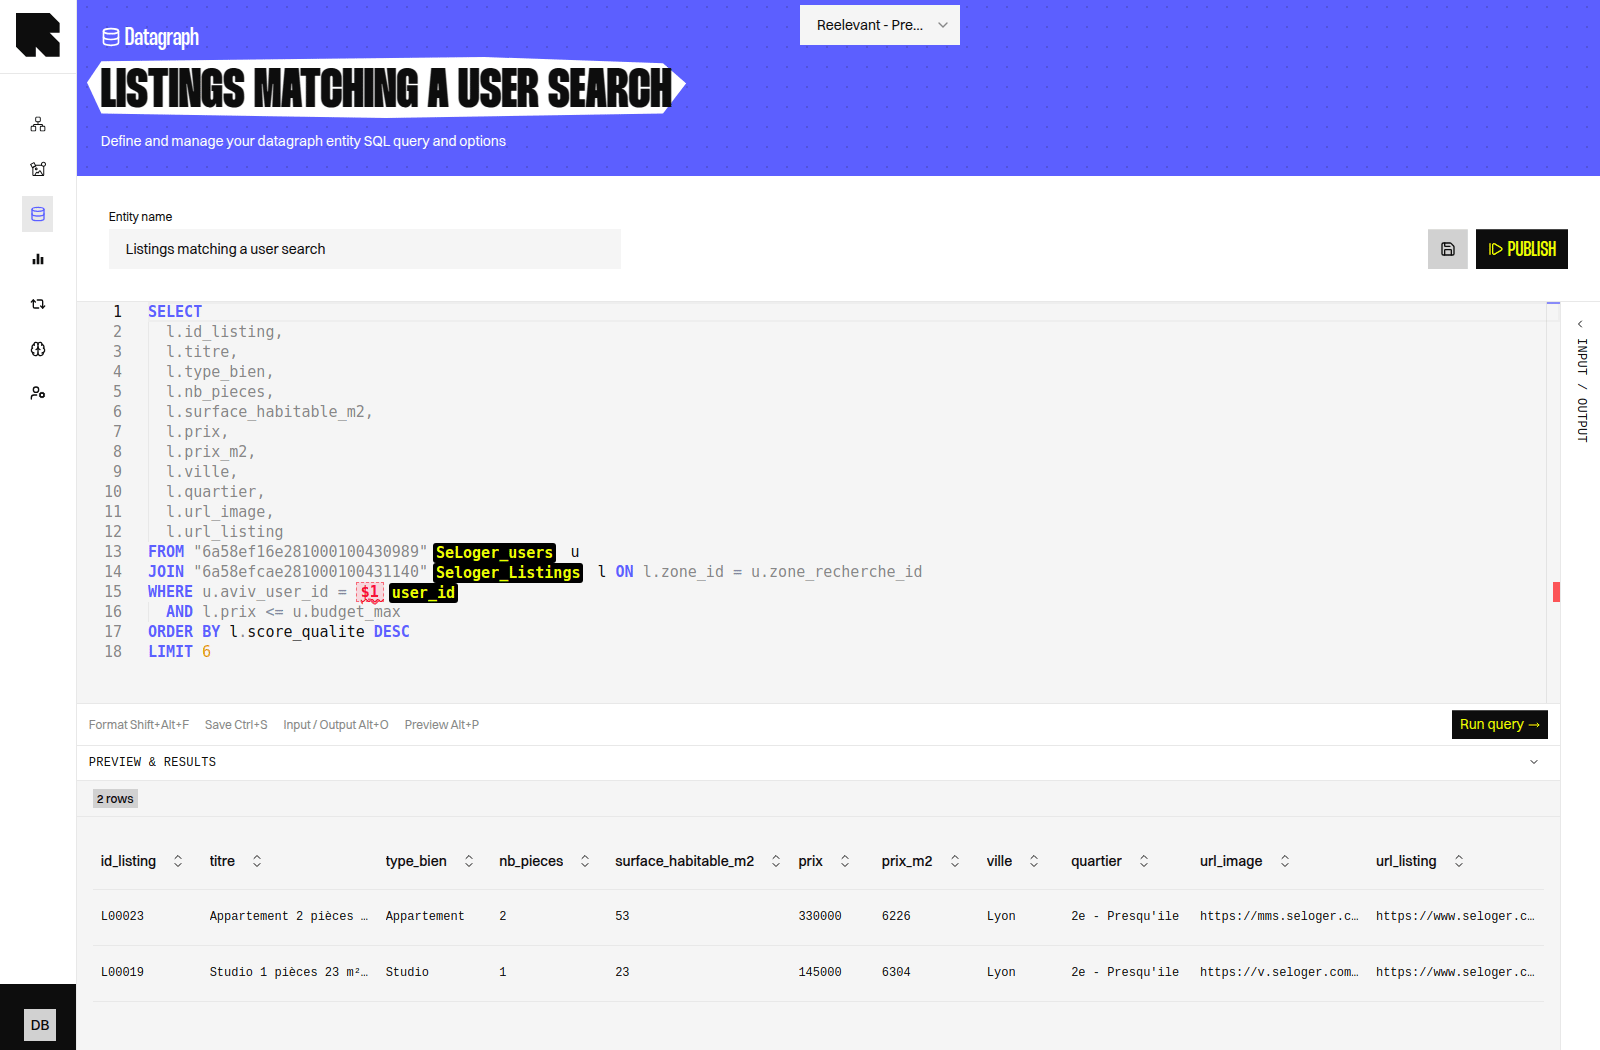
On an Entity page, the **Preview & results** panel shows a sample of the answer, so you can check the data before it goes live.
## What Entities Can Answer
An Entity answers one question about one person, one product, or one area. Your data team writes it once, and every Workflow can reuse it.
Here are typical examples for a property listings account:
| Entity | The question it answers |
| ------------------------------------- | --------------------------------------------------------------------------------------- |
| **Listings matching a user search** | Which listings sit in the area this person is searching, within their budget? |
| **Listings with a recent price drop** | Which listings in an area just became cheaper, biggest drop first? |
| **Market prices in the user area** | What is the median price per square metre and the trend where this person is searching? |
| **Recommended listings for a user** | Which listings does our recommendation data suggest for this person? |
| **Editorial content for an area** | Which guides and market articles are published for this area? |
The same patterns work for other businesses. A retail account might ask for the last items a person bought, the stock left in their favourite store, or the best sellers of their preferred category.
Describe the question you need in plain words, with the data it should return. Your data team turns it into an Entity, then you pick it in your Workflow.
On an Entity page, the **Preview & results** panel shows a sample of the answer, so you can check the data before it goes live.
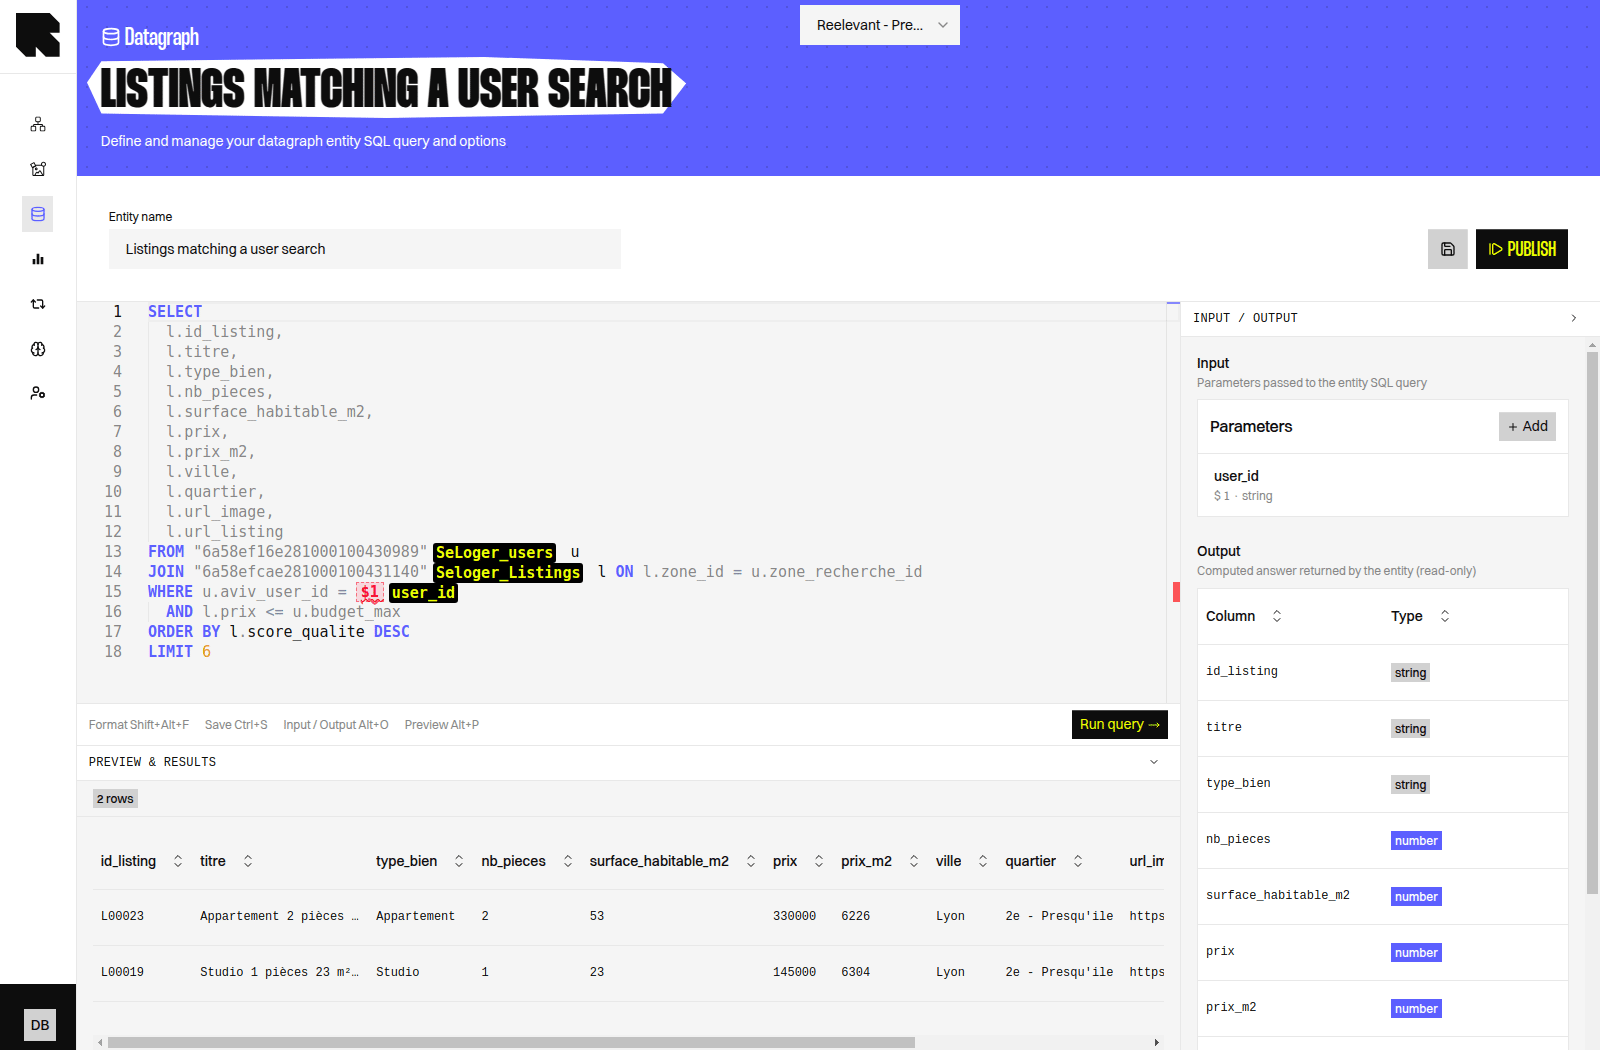
 The **Input / Output** panel lists the **Parameters** the Entity expects, and the fields it returns.
 ## Using an Entity in a Workflow
Once an Entity is published, it can be used in a Workflow with the **Query an entity** Data Node (a Node that fetches external data for the Workflow).
1. Open your Workflow in the [Workflow editor](/product-guide/workflows/editor).
2. Add the **Query an entity** Data Node.
3. Select the published Entity you need.
4. Fill in the Entity parameters, either with a fixed value or with a Workflow variable.
5. Use the returned data in your [Content](/product-guide/contents/overview) or in a [Condition](/product-guide/workflows/logic-nodes/conditions).
See [Query an Entity](/product-guide/workflows/data-nodes/datagraph) for the full Node walkthrough.
Only users with the tech admin role can configure this Node. Ask your administrator if the Node appears read-only. See [Permissions](/product-guide/account/permissions) for the Datagraph Schema and Datagraph Entity permissions.
## What's Next?
Learn how Datasources are imported and configured.
Understand the data model, versions, and Entities in detail.
Read a join match analysis and fix weak links.
See who can view, edit, and publish Datagraph objects.
## Using an Entity in a Workflow
Once an Entity is published, it can be used in a Workflow with the **Query an entity** Data Node (a Node that fetches external data for the Workflow).
1. Open your Workflow in the [Workflow editor](/product-guide/workflows/editor).
2. Add the **Query an entity** Data Node.
3. Select the published Entity you need.
4. Fill in the Entity parameters, either with a fixed value or with a Workflow variable.
5. Use the returned data in your [Content](/product-guide/contents/overview) or in a [Condition](/product-guide/workflows/logic-nodes/conditions).
See [Query an Entity](/product-guide/workflows/data-nodes/datagraph) for the full Node walkthrough.
Only users with the tech admin role can configure this Node. Ask your administrator if the Node appears read-only. See [Permissions](/product-guide/account/permissions) for the Datagraph Schema and Datagraph Entity permissions.
## What's Next?
Learn how Datasources are imported and configured.
Understand the data model, versions, and Entities in detail.
Read a join match analysis and fix weak links.
See who can view, edit, and publish Datagraph objects.