

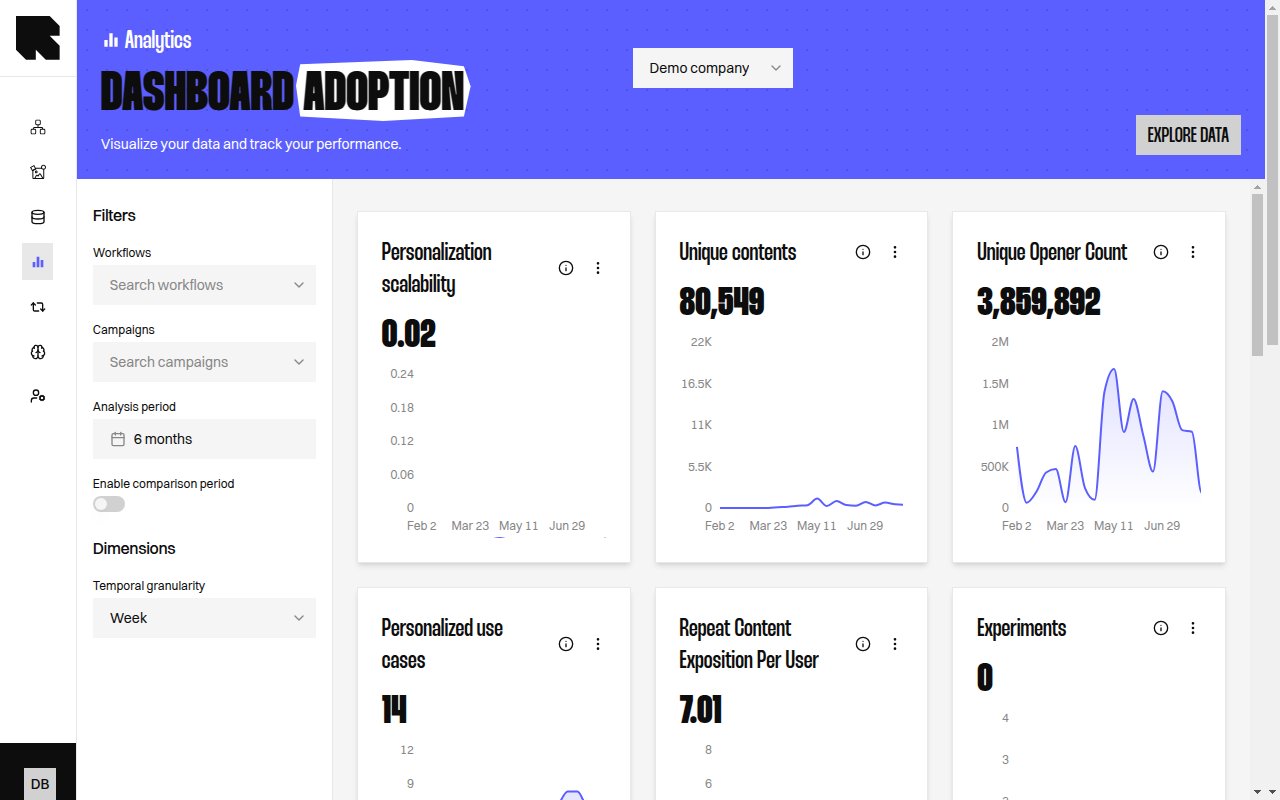
Before you begin
Performance answers what your Workflows produced. Adoption answers a different question: how much of the platform is actually in use, and how much variety reaches each customer. Every measure here reads Workflow activity, so none of them needs a purchase dataset. Only the lifecycle transitions matrix reads purchases, through the attribution source configured in Analytics Settings.What is measured
Every measure is computed over the period you query, on displays served by Reelevant. The dashboard opens on the last three months, since adoption reads as a trend rather than as a week.
Personalisation scalability is the ratio to read first. A value near zero means your Workflows serve the same output to everybody, whatever their volume. A value near one means almost every customer receives their own Content.
Use Case adoption
The table lists the Workflows that served personalised Content over the period, with the Datasources feeding them and how much they were displayed.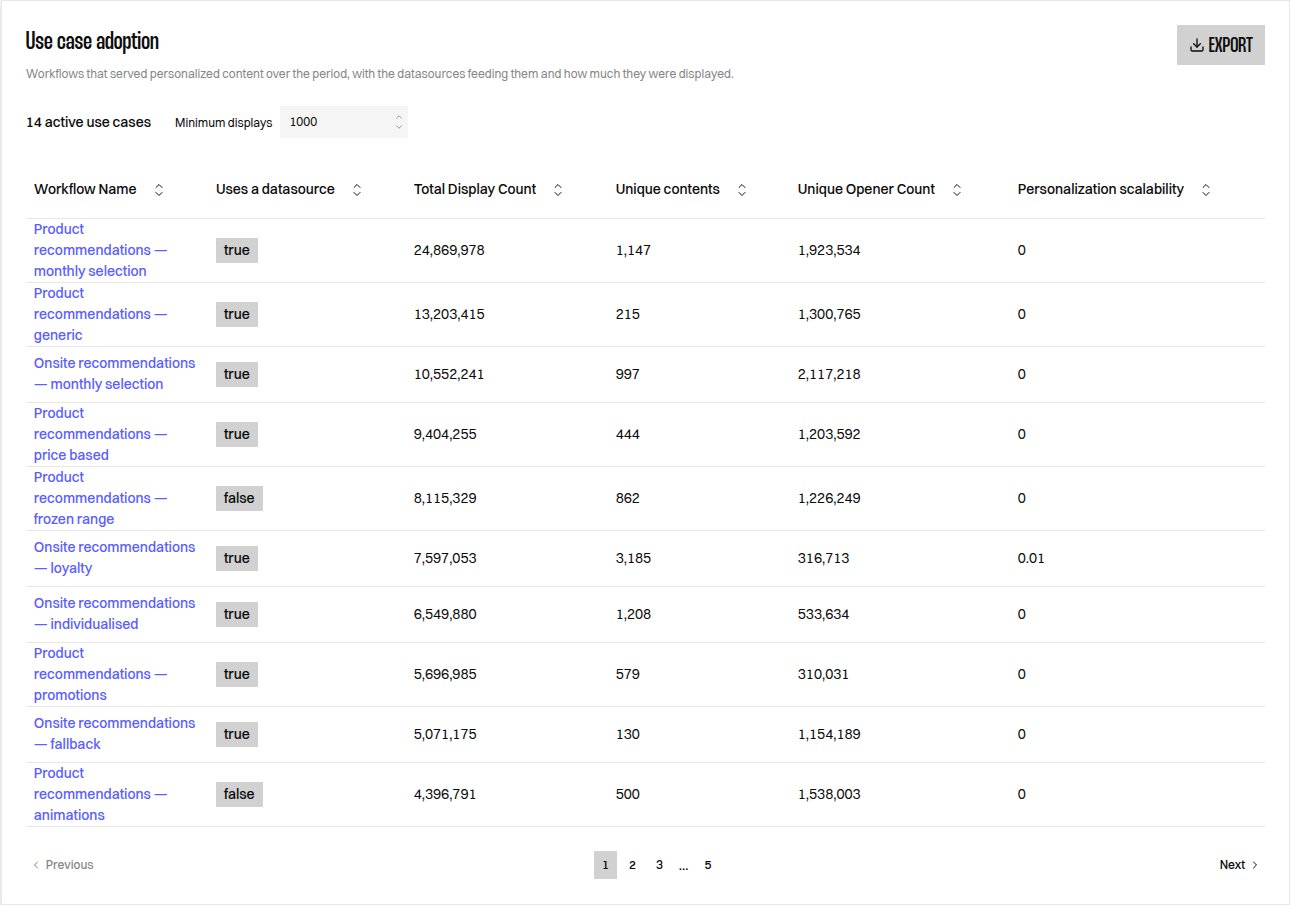
Minimum displays filters out Workflows too small to read, and defaults to 1,000. The table exports to CSV.
Read scalability per Workflow rather than only at the top. A single high-volume Workflow serving one Content per period pulls the overall ratio down, and hides the Workflows where personalisation is working.
Lifecycle transitions
The matrix counts how many customers moved from one lifecycle stage to another between the start and the end of the period.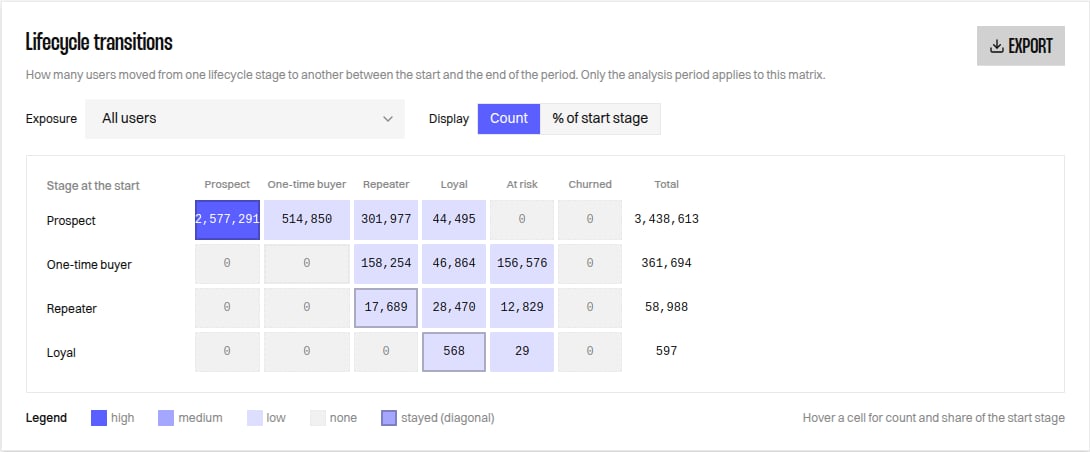
The Exposed Population is now defined by exposure to personalisation, so customers whose experience was only partly personalised sit in none of the two populations. The two sub-matrices therefore do not add up to the one over all customers.