

Overview
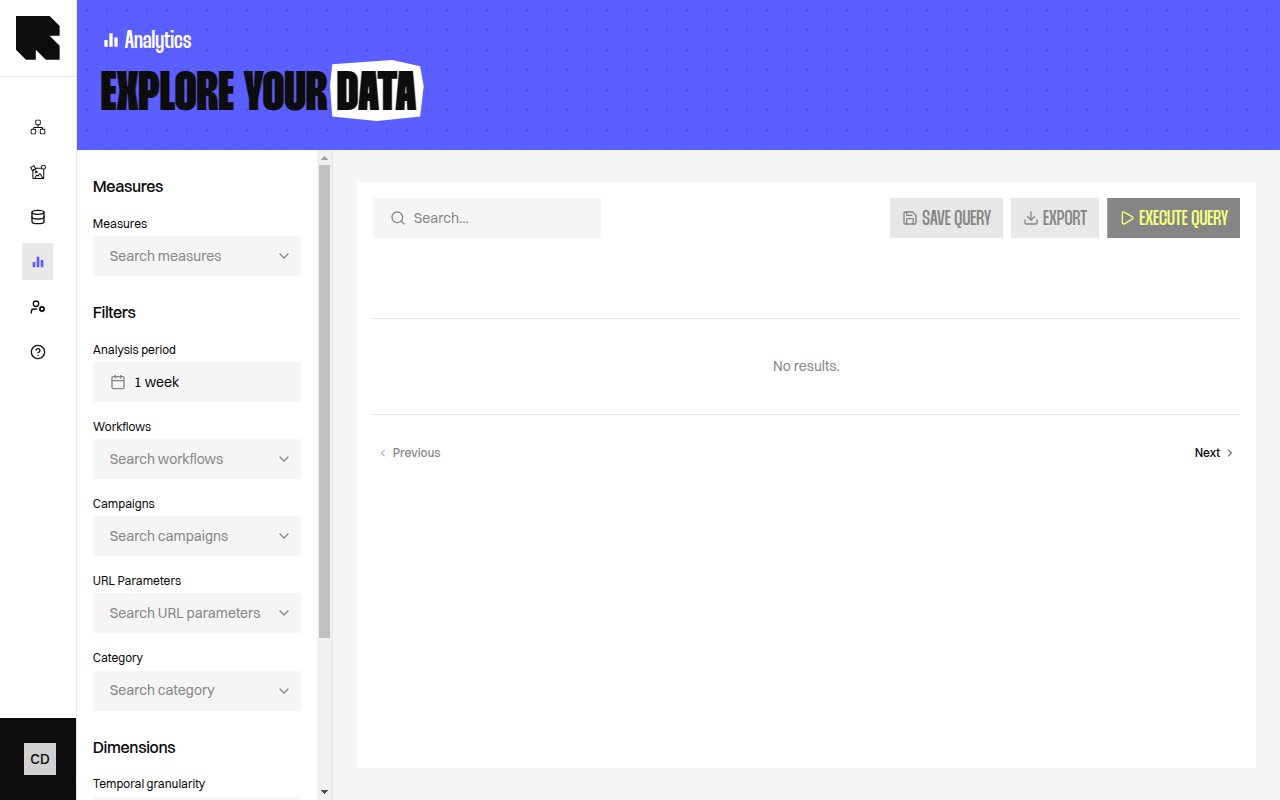
The Data Exploration page lets you build custom analytics queries to explore your data beyond the pre-built dashboards. Combine measures, dimensions, and filters to answer specific business questions.Query Builder
The query builder has several configuration sections:Measures
Select the metrics you want to analyze:
Available measures include Workflow event metrics (impressions, reached individuals, displays, and clicks) and purchase metrics (conversions, revenue, and buyers). See the measures and dimensions reference.
Dimensions
Group your data by one or more attributes:
Available dimensions include:
Temporal Granularity
Filters
All dashboard filters are available — Workflows, Campaigns, URL Parameters, Category, and Analysis period.Executing a Query
Click Execute query to run the query. Results appear in a table below the builder.Result Warnings
The results table may show contextual warnings:- Workflow Branch dimension — “Don’t forget to use other dimensions such as ‘Content Name’ or ‘Workflow Name’ if pertinent in your analysis.”
- Mixing event types — “You are mixing workflow events measures and from purchase events dimensions. This should be avoided.”
- URL Parameter Value without filter — “You are using the dimension ‘URL Parameter Value’ without filtering on a specific parameter.”