

Before you begin
Reports use the Analytics data available for your company. A report can only answer questions supported by that data. Always review the evidence, methodology, and limitations before sharing a result. Generated analysis can require additional business context.Create a report
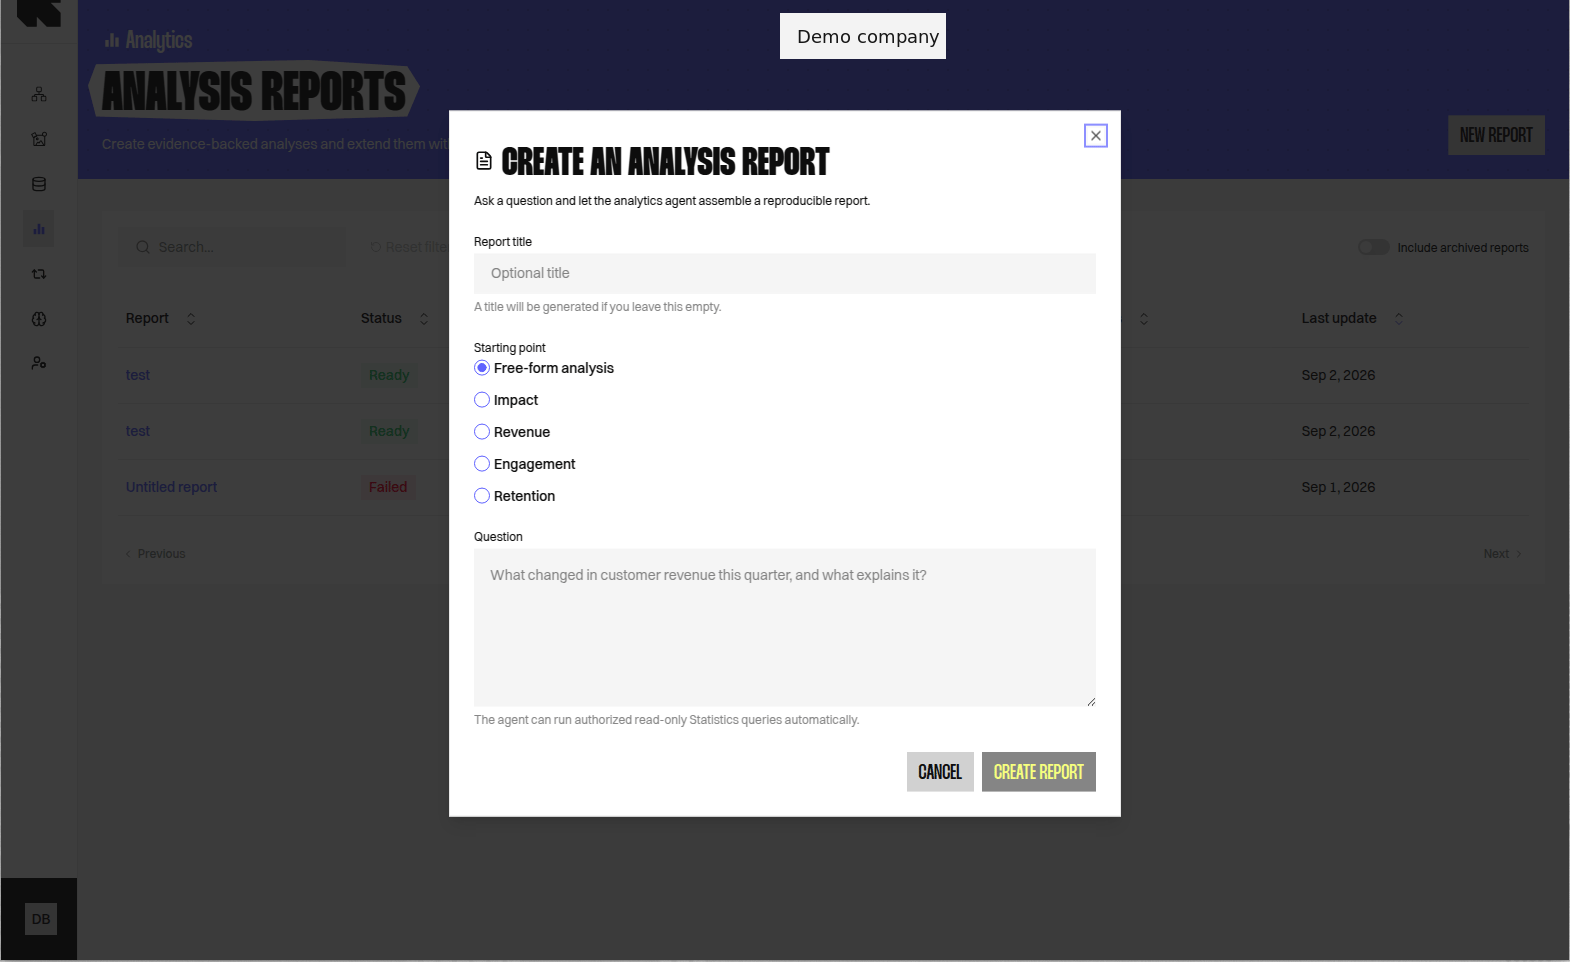
- Open Analytics > Reports > List.
- Select New report.
- Add an optional title.
- Choose a suggested starting point or Free-form analysis.
- Review and edit the Question.
- Select Create report.
A failed report keeps its available evidence. Retry availability depends on the failure and the report’s current state.
Ask a follow-up question
Use the follow-up area below a completed report to request another section. Your question and the person who asked it remain linked to that section. Follow-up questions use the existing report as context. Ask one focused question at a time for clearer results.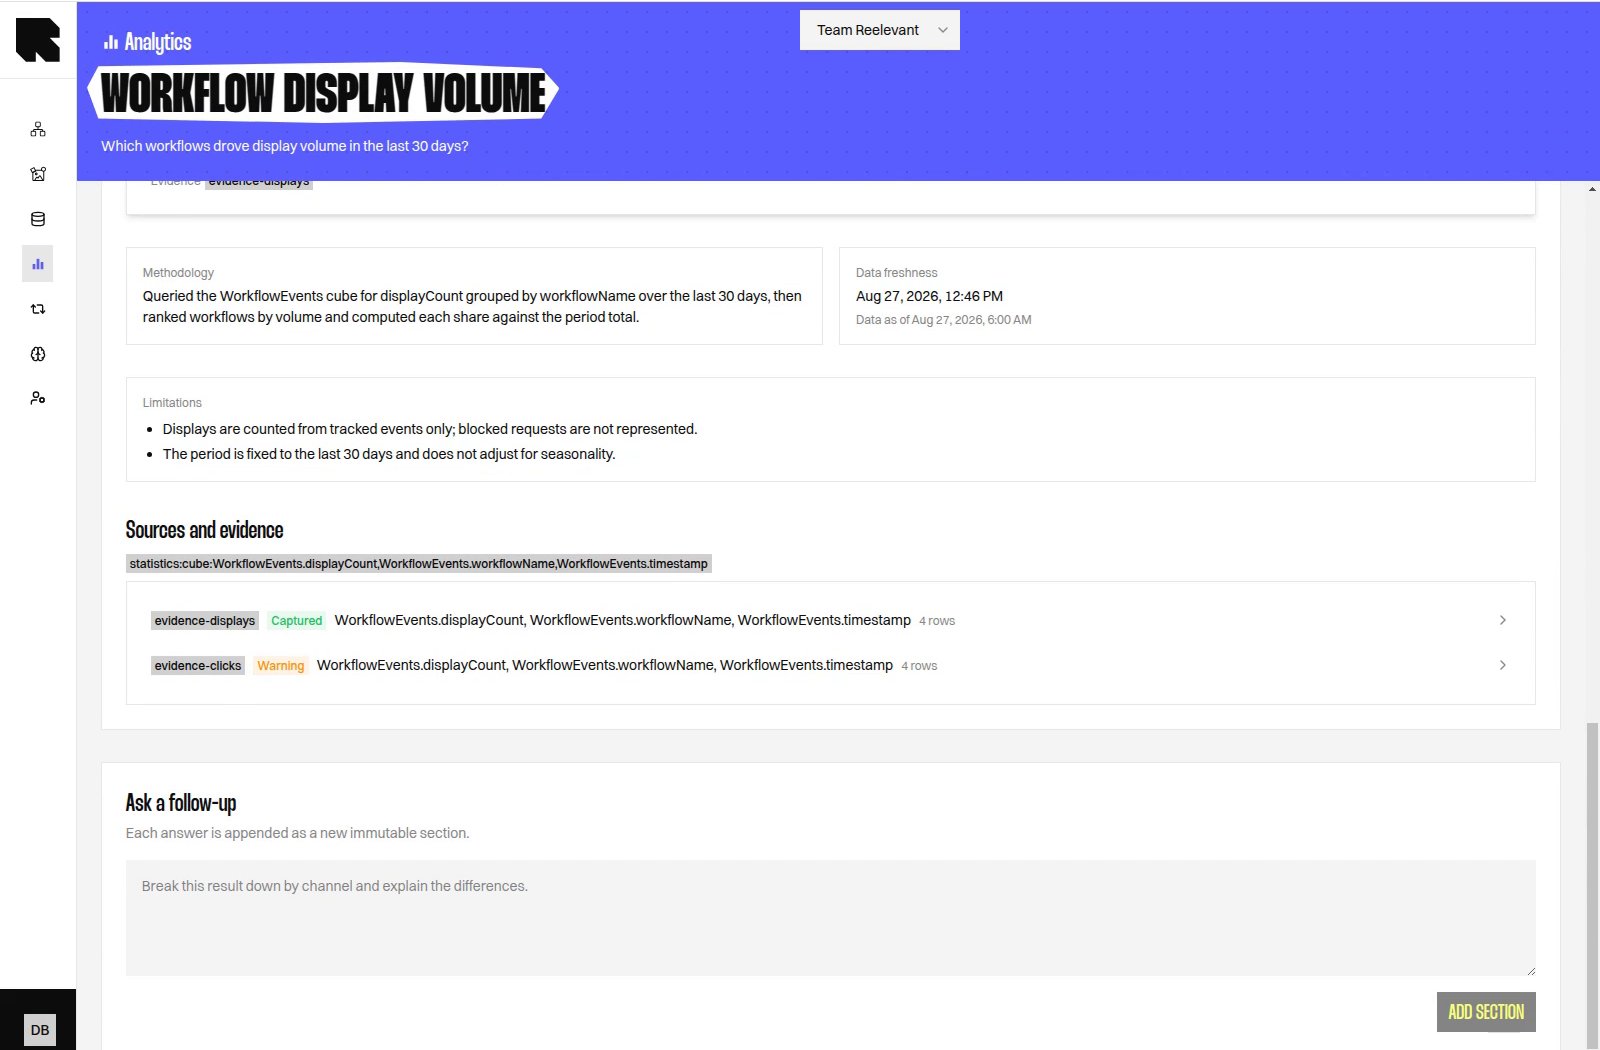
Review report evidence
Each section can include narrative findings, tables, charts, sources, methodology, and limitations. Evidence links show which Analytics results support the section. Check the selected period and measures before using a finding. A stated limitation explains where the available data cannot support a stronger conclusion.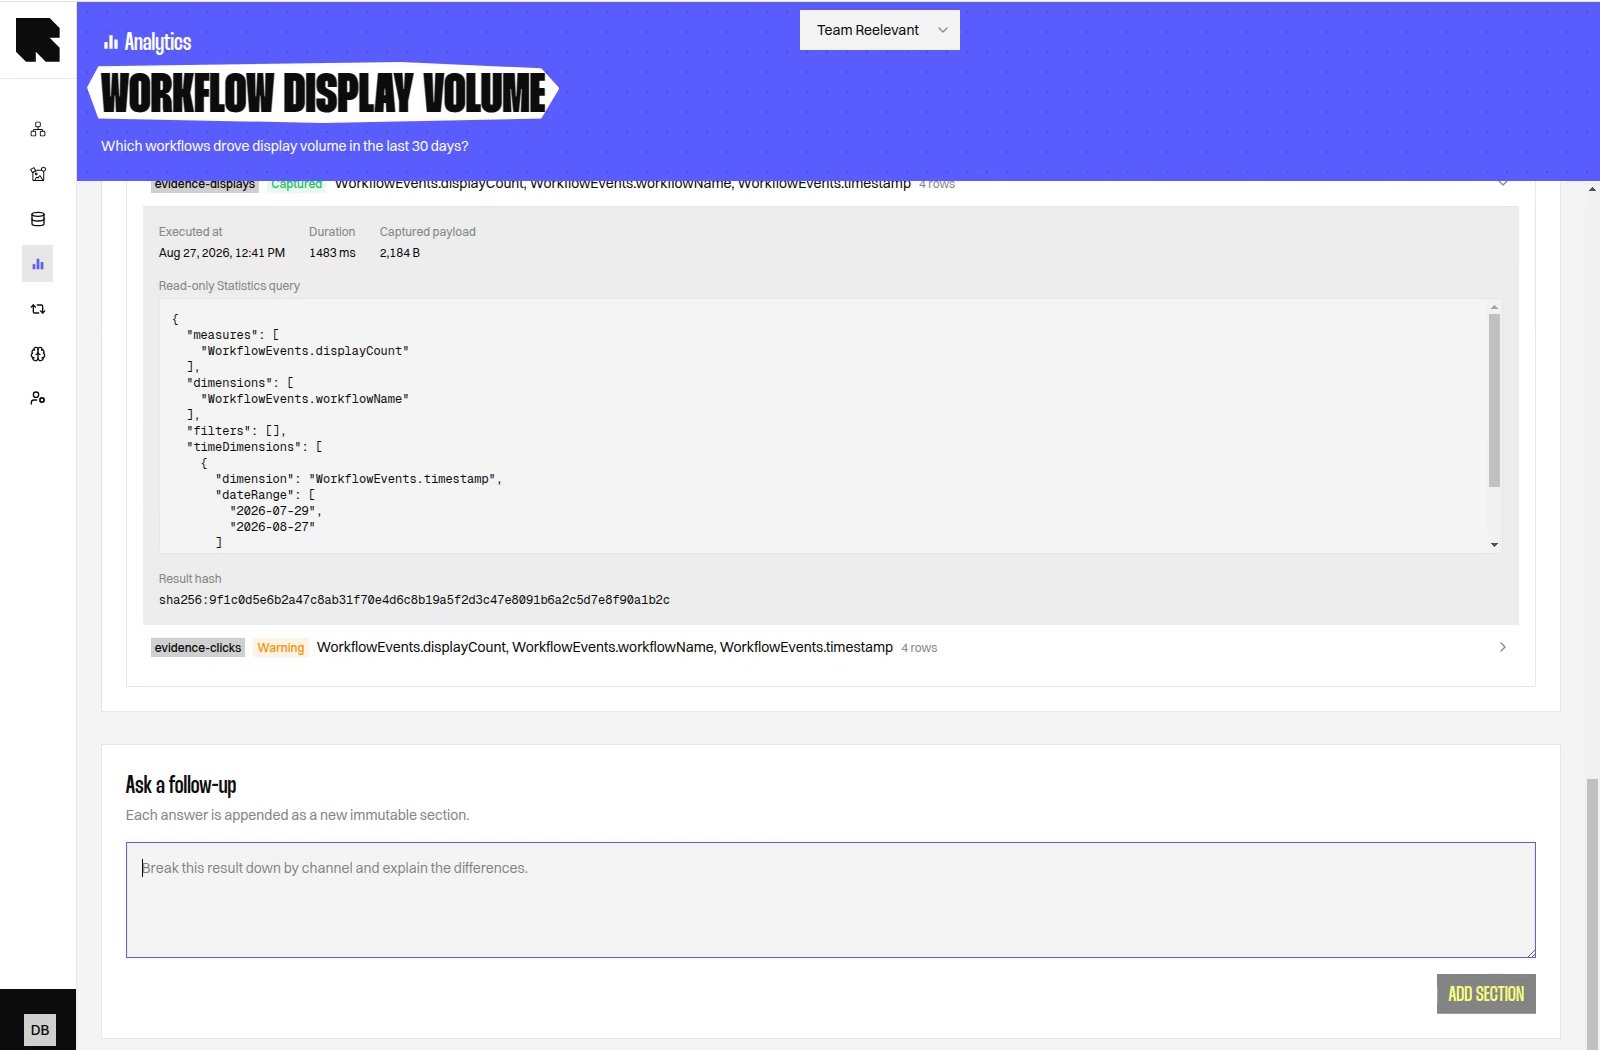
Automatic reports
Automatic reports create a new period report on a monthly, quarterly, or yearly schedule. Each completed period remains available in its report history. Platform administrators with permission to manage Analytics Settings can configure the schedule, language, timezone, and prompt. Your Reelevant Customer Success contact can help with this setup. Automatic reports appear inside the Reports menu.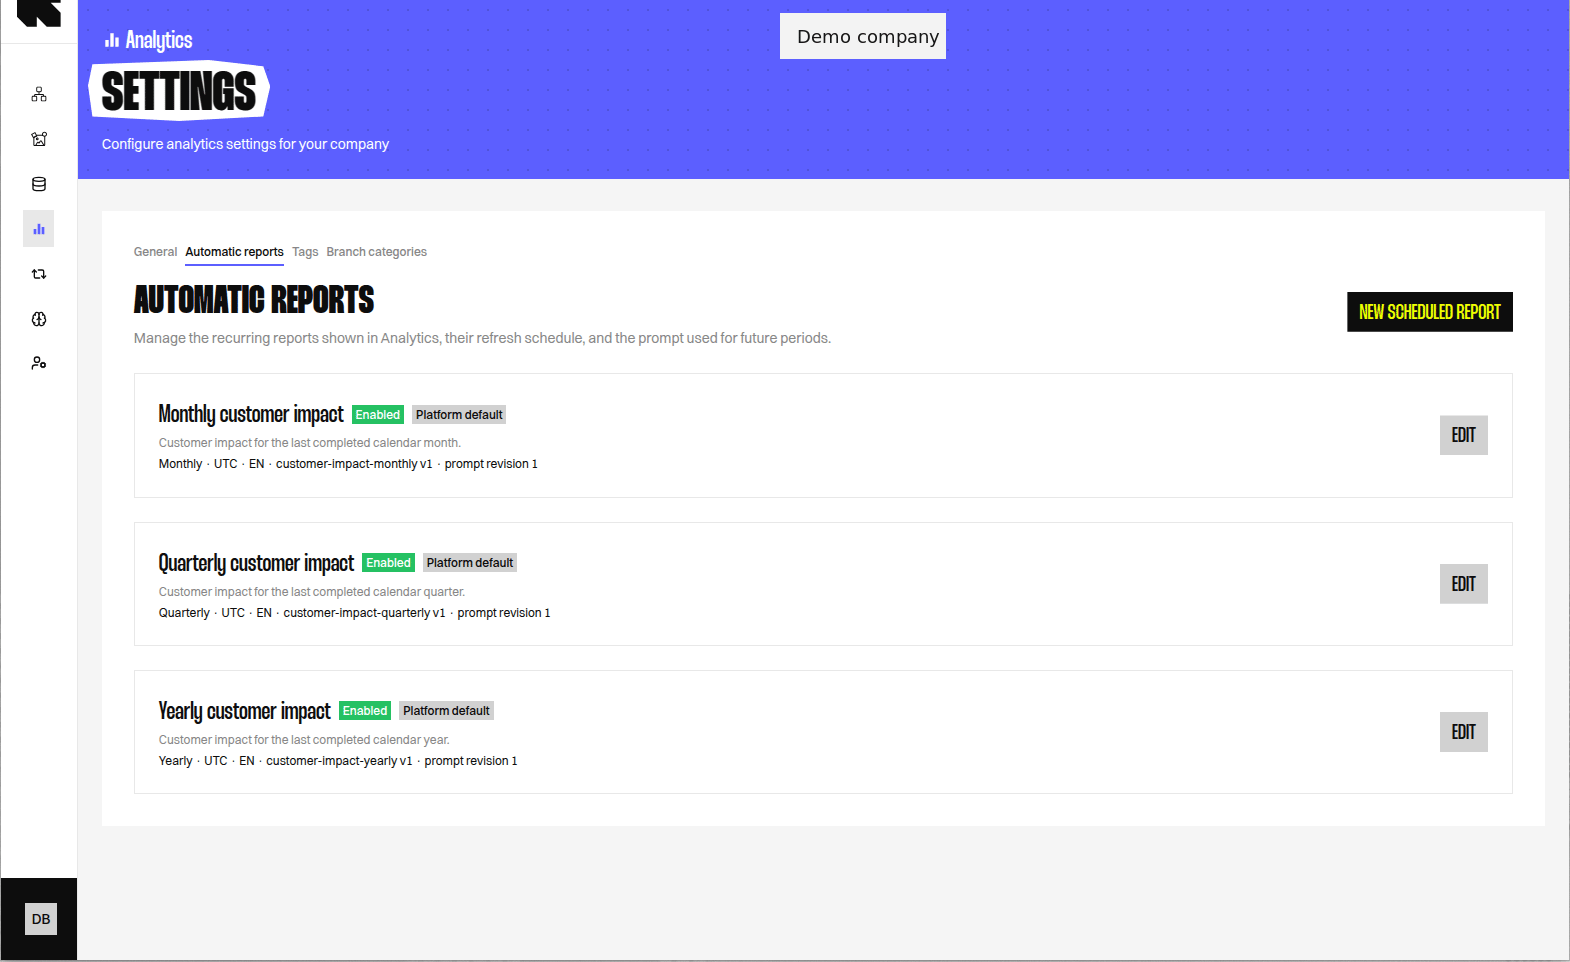
An automatic report can be blocked when its requested analysis is unsupported by your configured Analytics data. The report shows the reason instead of generating an unreliable result.
What’s Next?
Advanced Reports Guide
Review automatic report configuration, period history, and reliability controls.
Data Exploration
Explore the measures and dimensions available for your analysis.
Analytics Settings
Review the Analytics configuration that supports report results.