

Why Use the Datagraph?
Each Datasource holds one set of data — products, stores, purchases, or customers. On its own, a Datasource cannot answer a question that needs two sets of data at once. The Datagraph links Datasources together. Once linked, your data team can prepare reusable Entities (saved questions such as “top five products bought by this person”) that any Workflow can reuse.Where to Find It
Open DataHub in the sidebar, then choose Datagraph. You will see three pages:
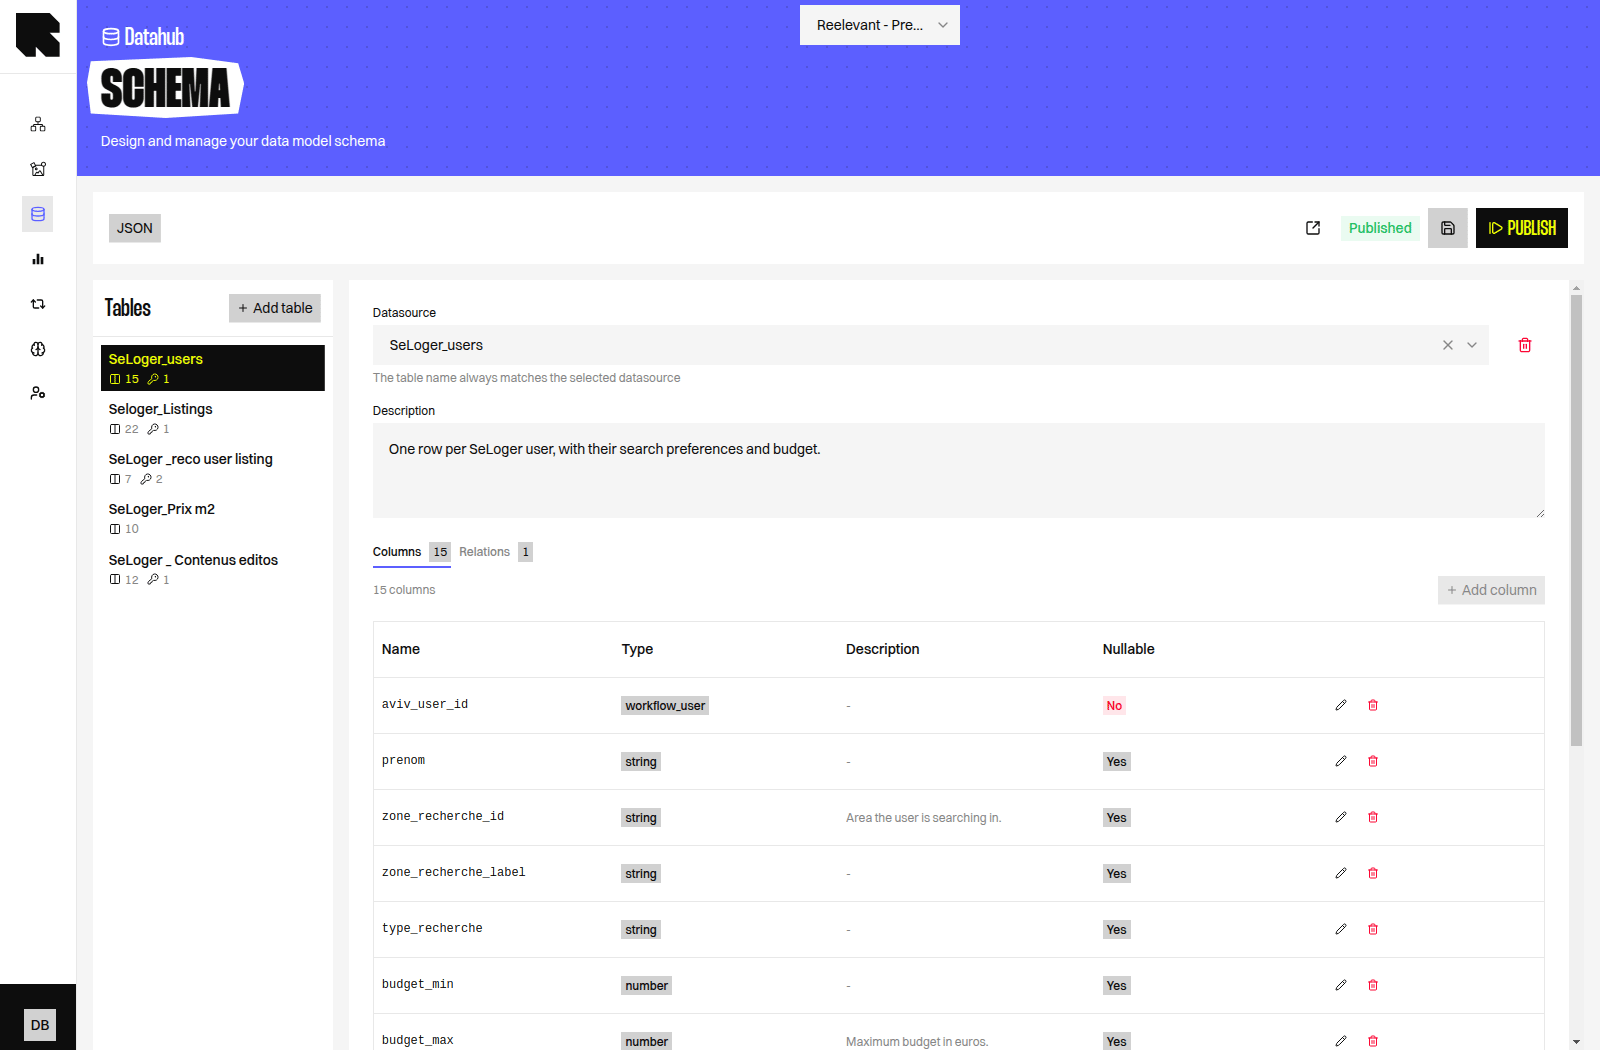
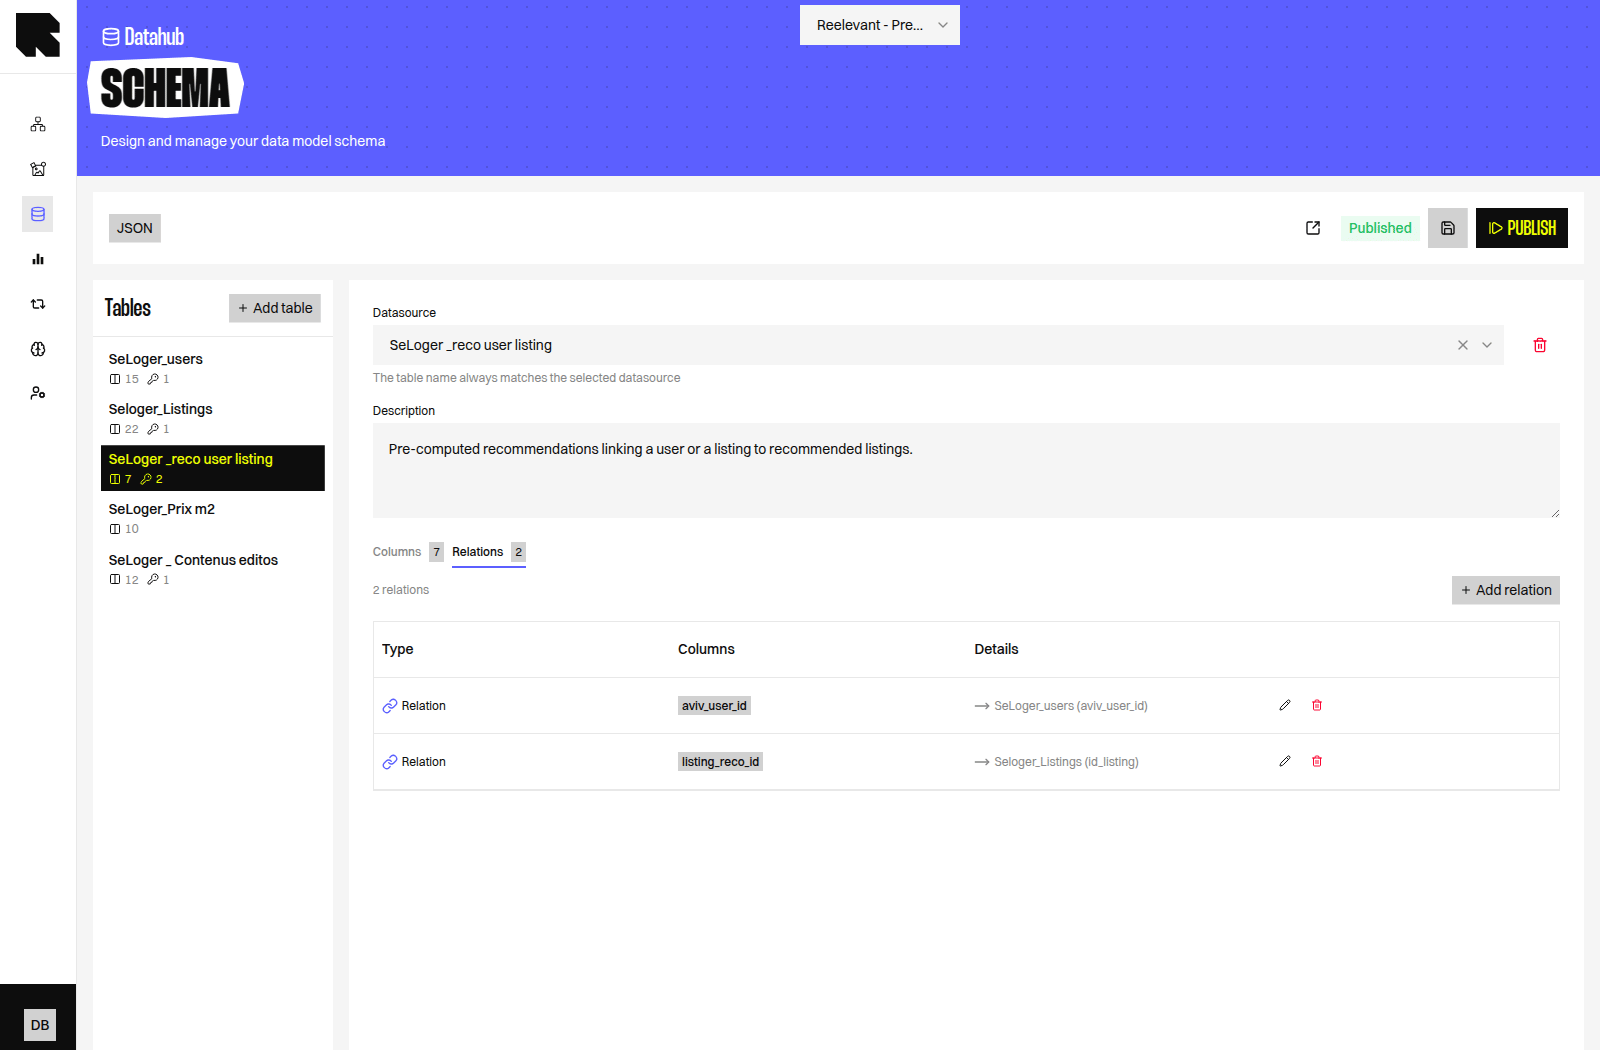
On the Schema page, the Tables panel on the left lists the Datasources in the model. Selecting a table shows its Columns and its Relations (the links to other tables).
Understanding the Explorer
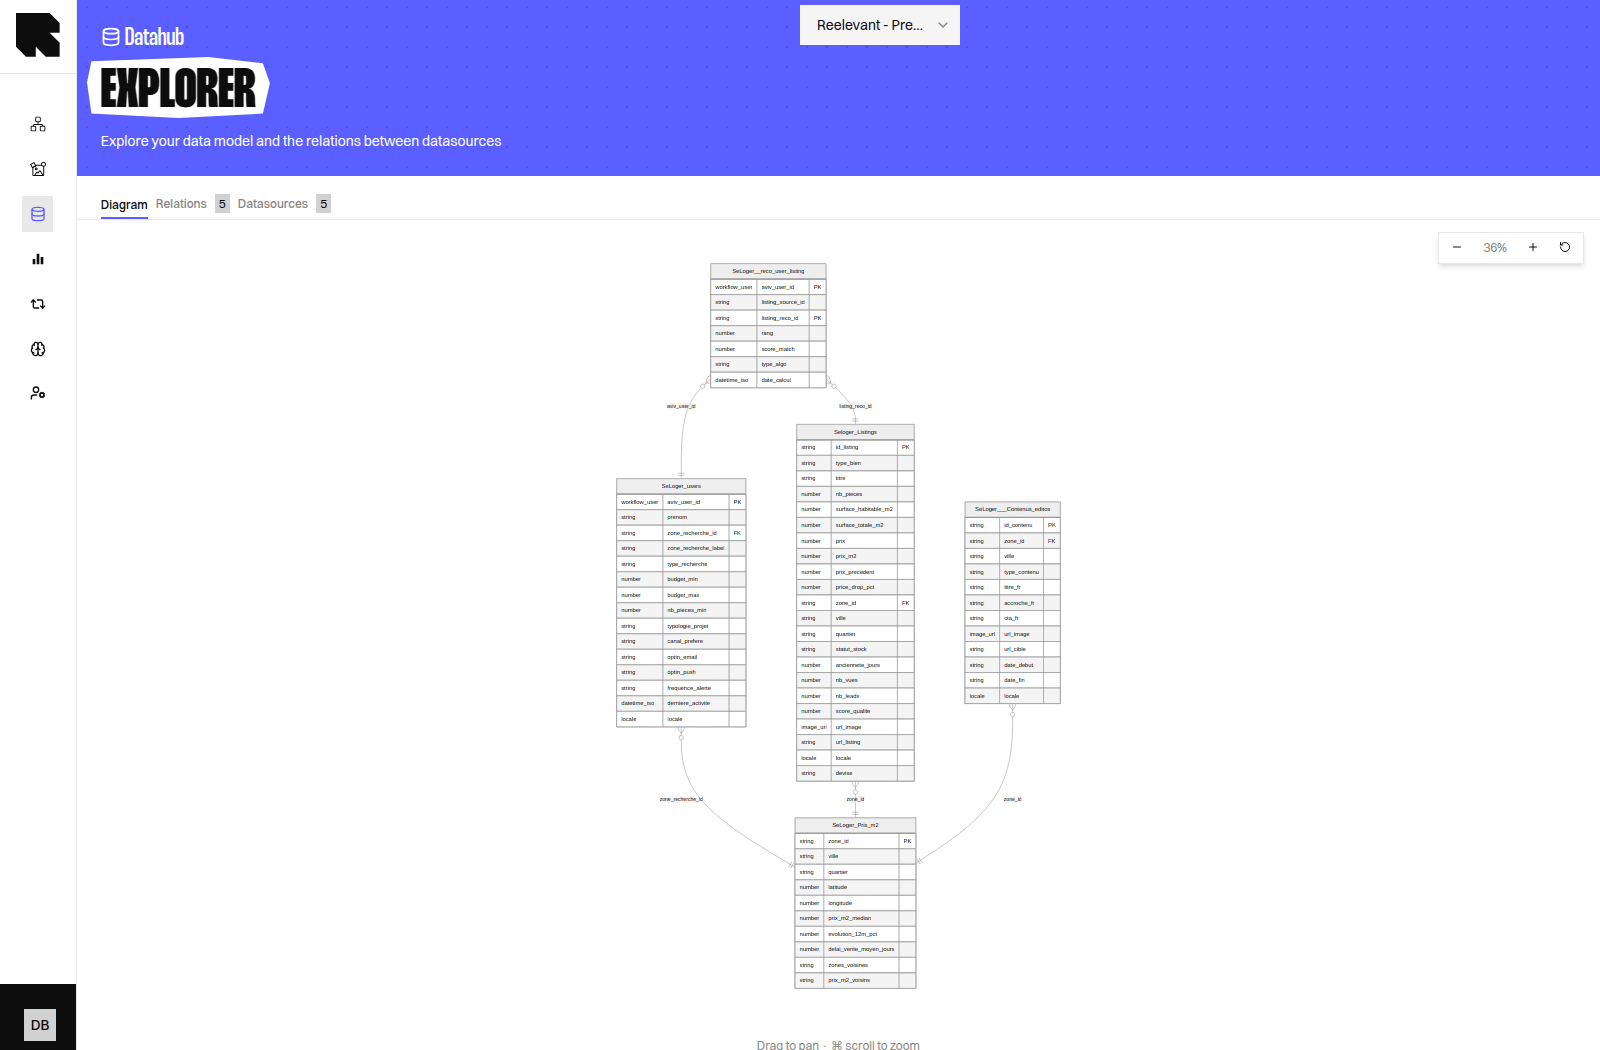
The Explorer is the most useful page if you simply want to understand your data.- Open DataHub → Datagraph → Explorer.
- Stay on the Diagram tab to see every Datasource as a box, with lines showing how they are linked.
- Drag the diagram to move around, and use the zoom buttons to get closer.
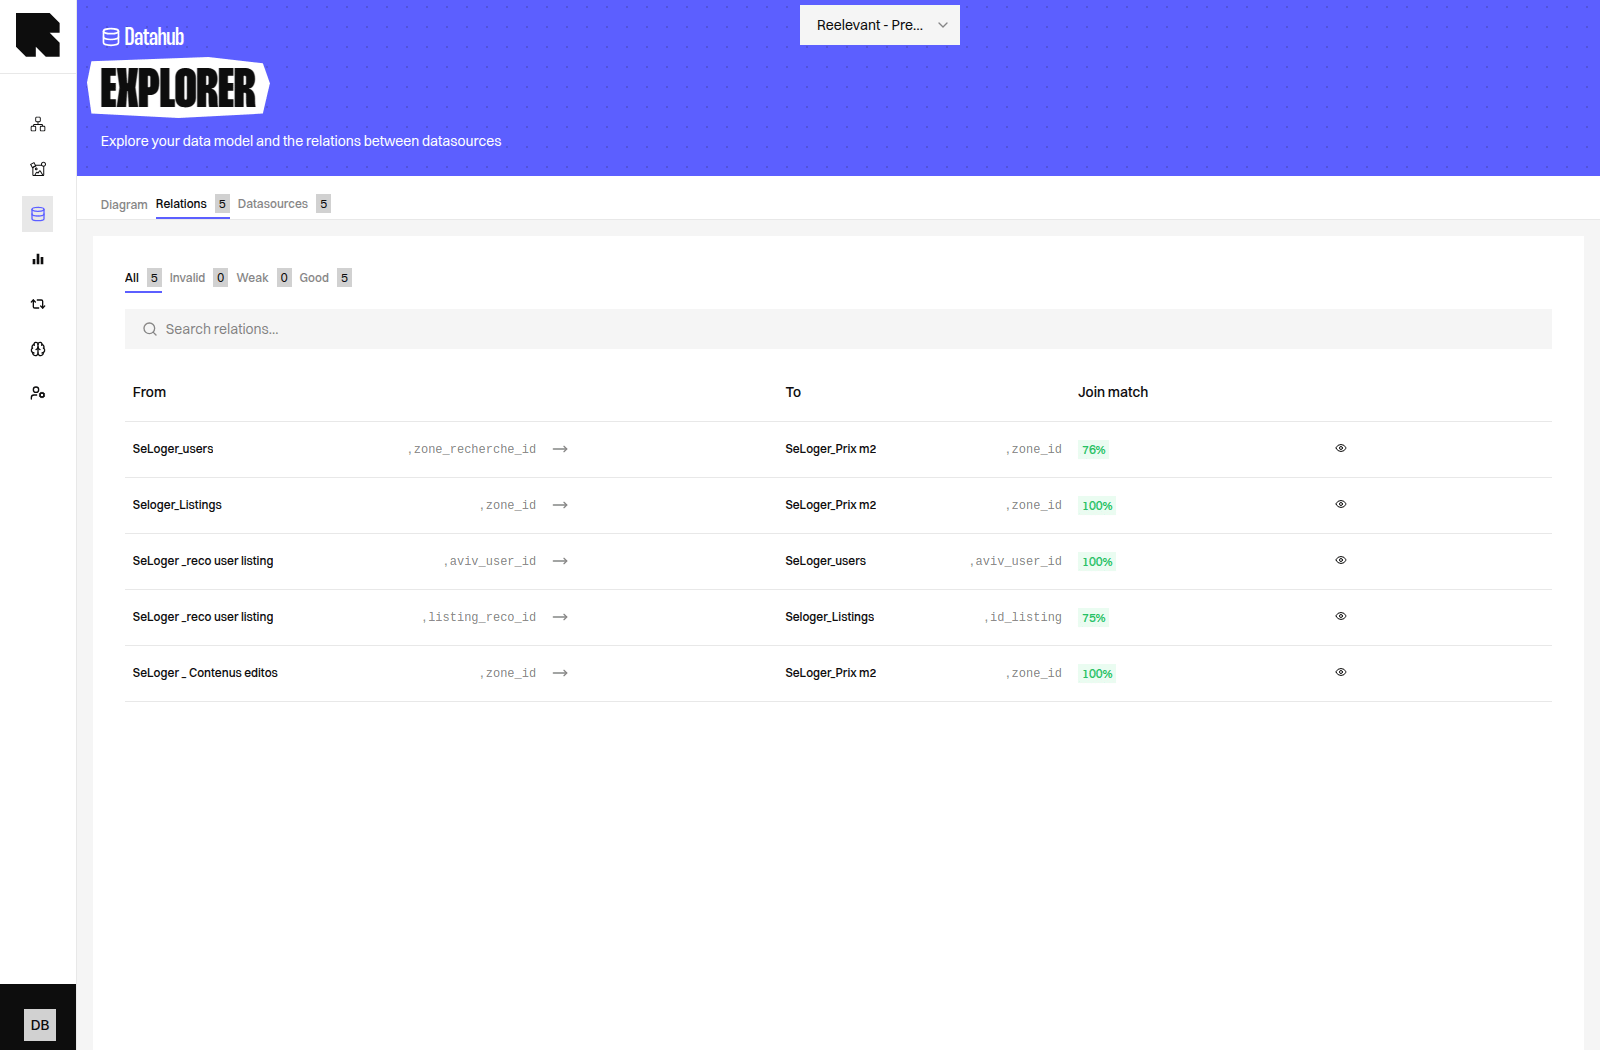
- Open the Relations tab to review each link one by one.
- Open the Datasources tab to list the Datasources used in the model, with their fields.
If the Explorer asks you to create a Schema first, the Datagraph has not been set up yet. Ask your data team or your Technical Account Manager to build it.
Draft and Published Versions
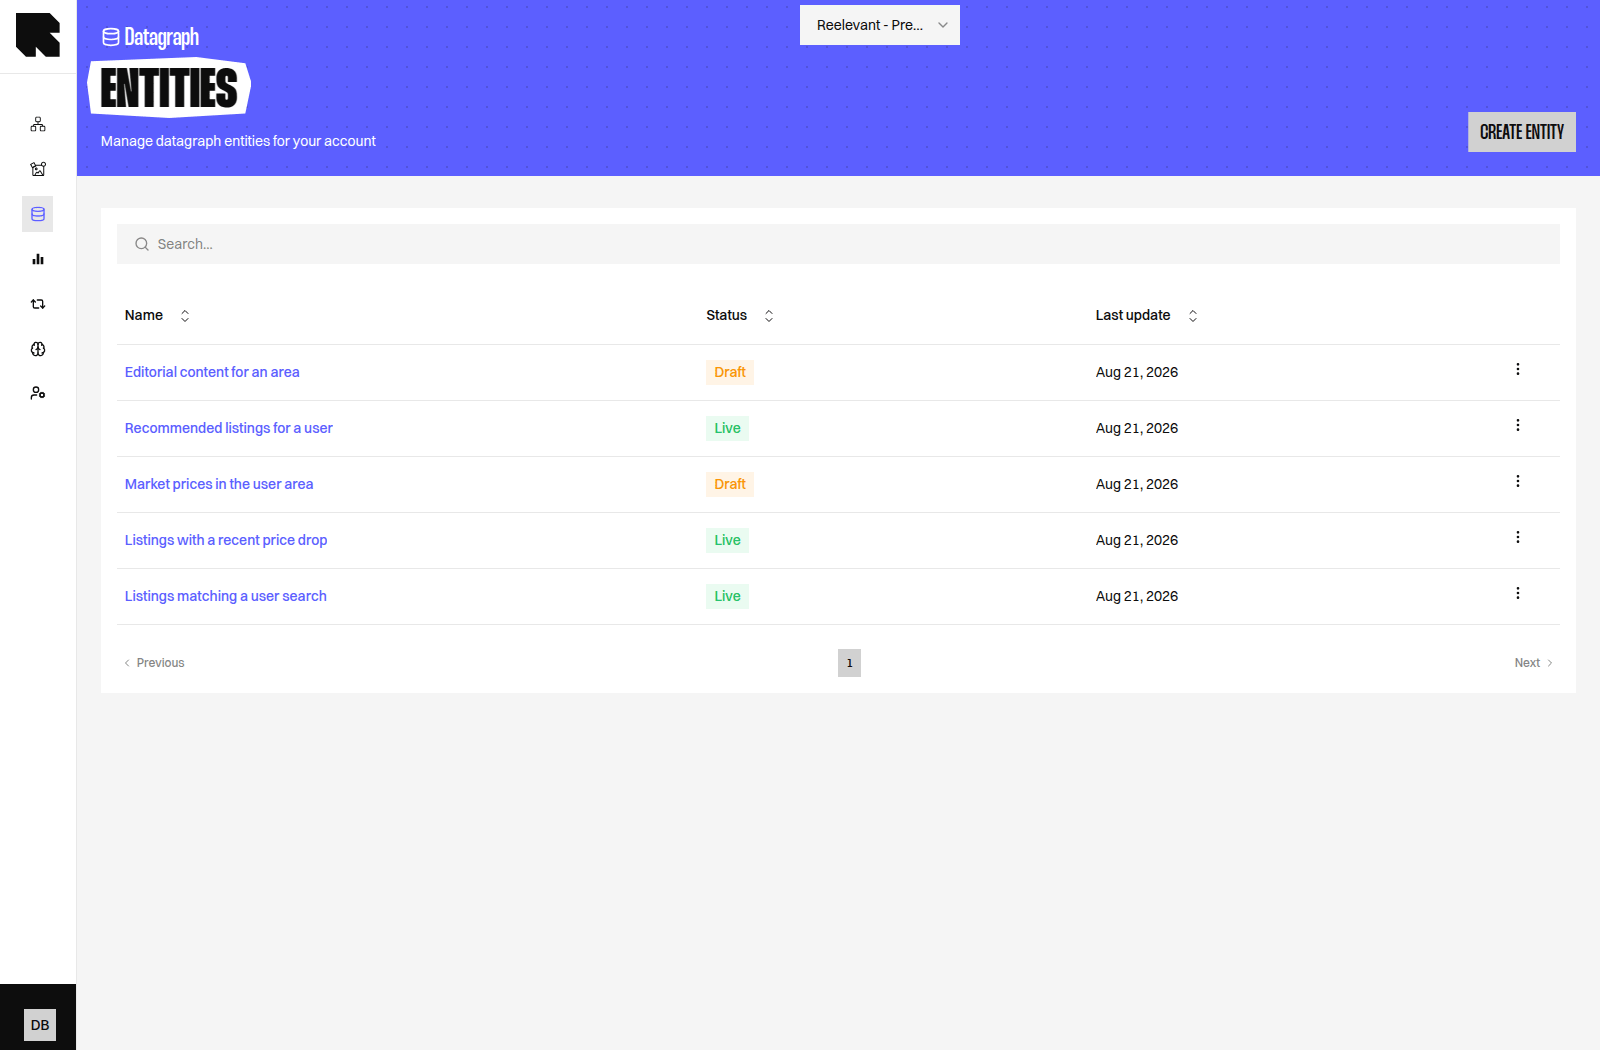
The Schema and each Entity have their own version, shown as a status.
Nothing you see in a Draft affects your live personalisation until someone publishes it.
What Entities Can Answer
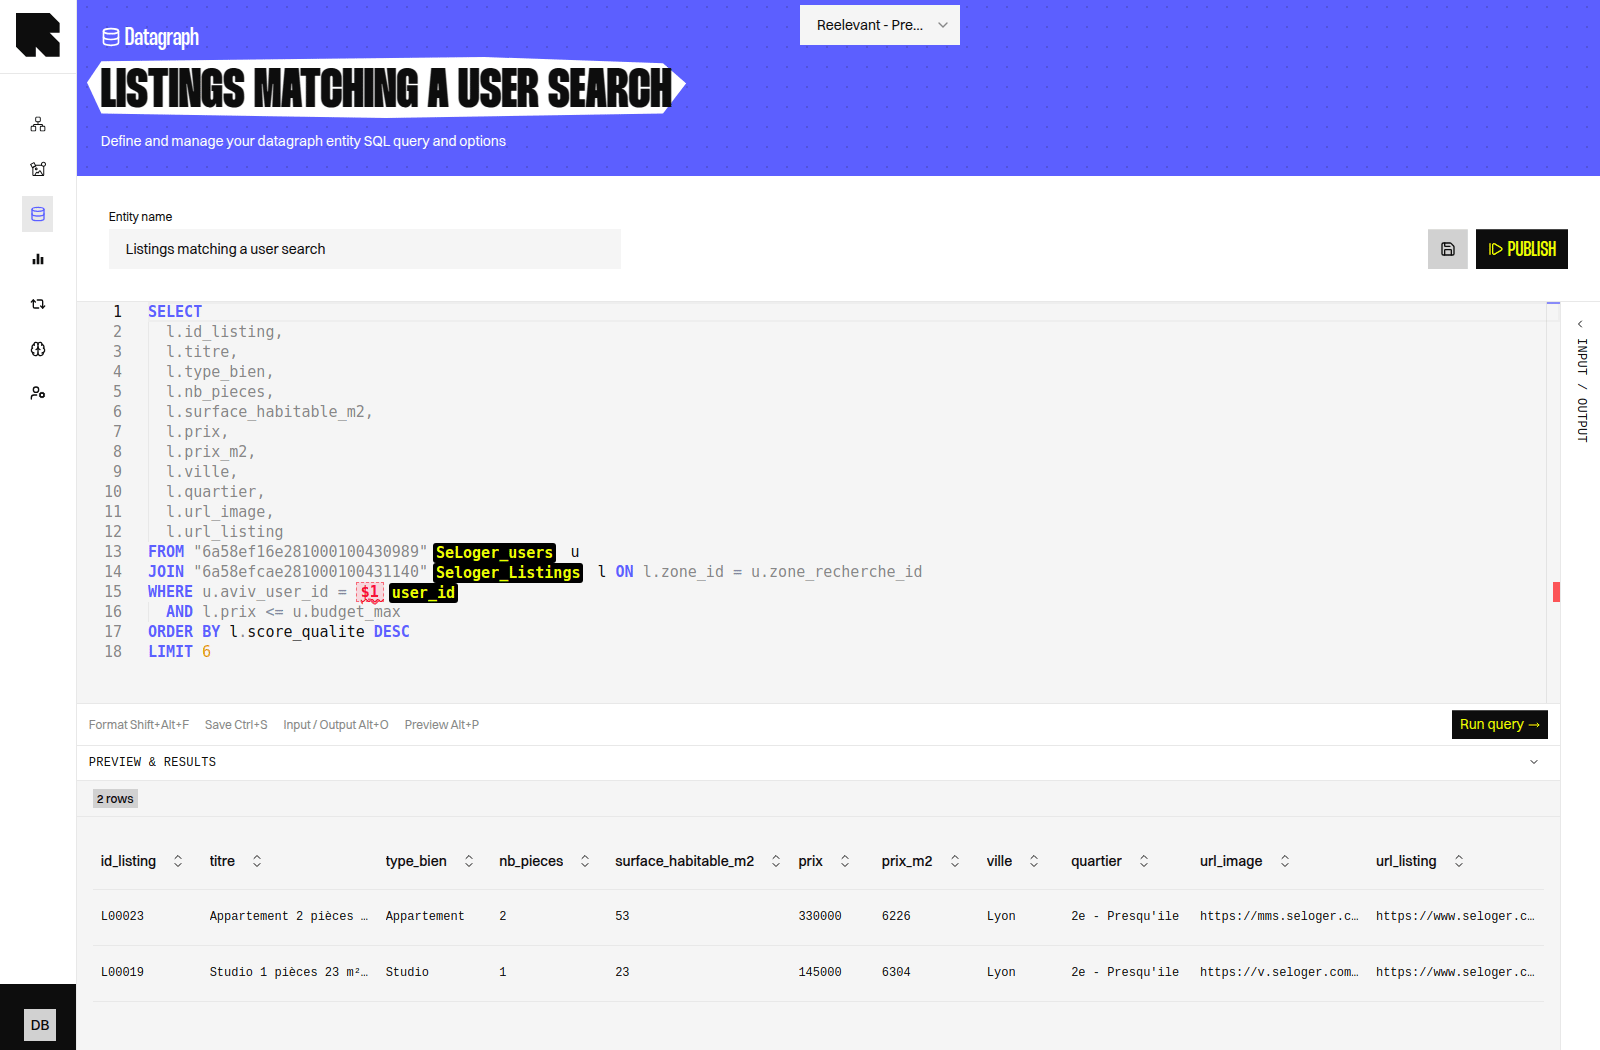
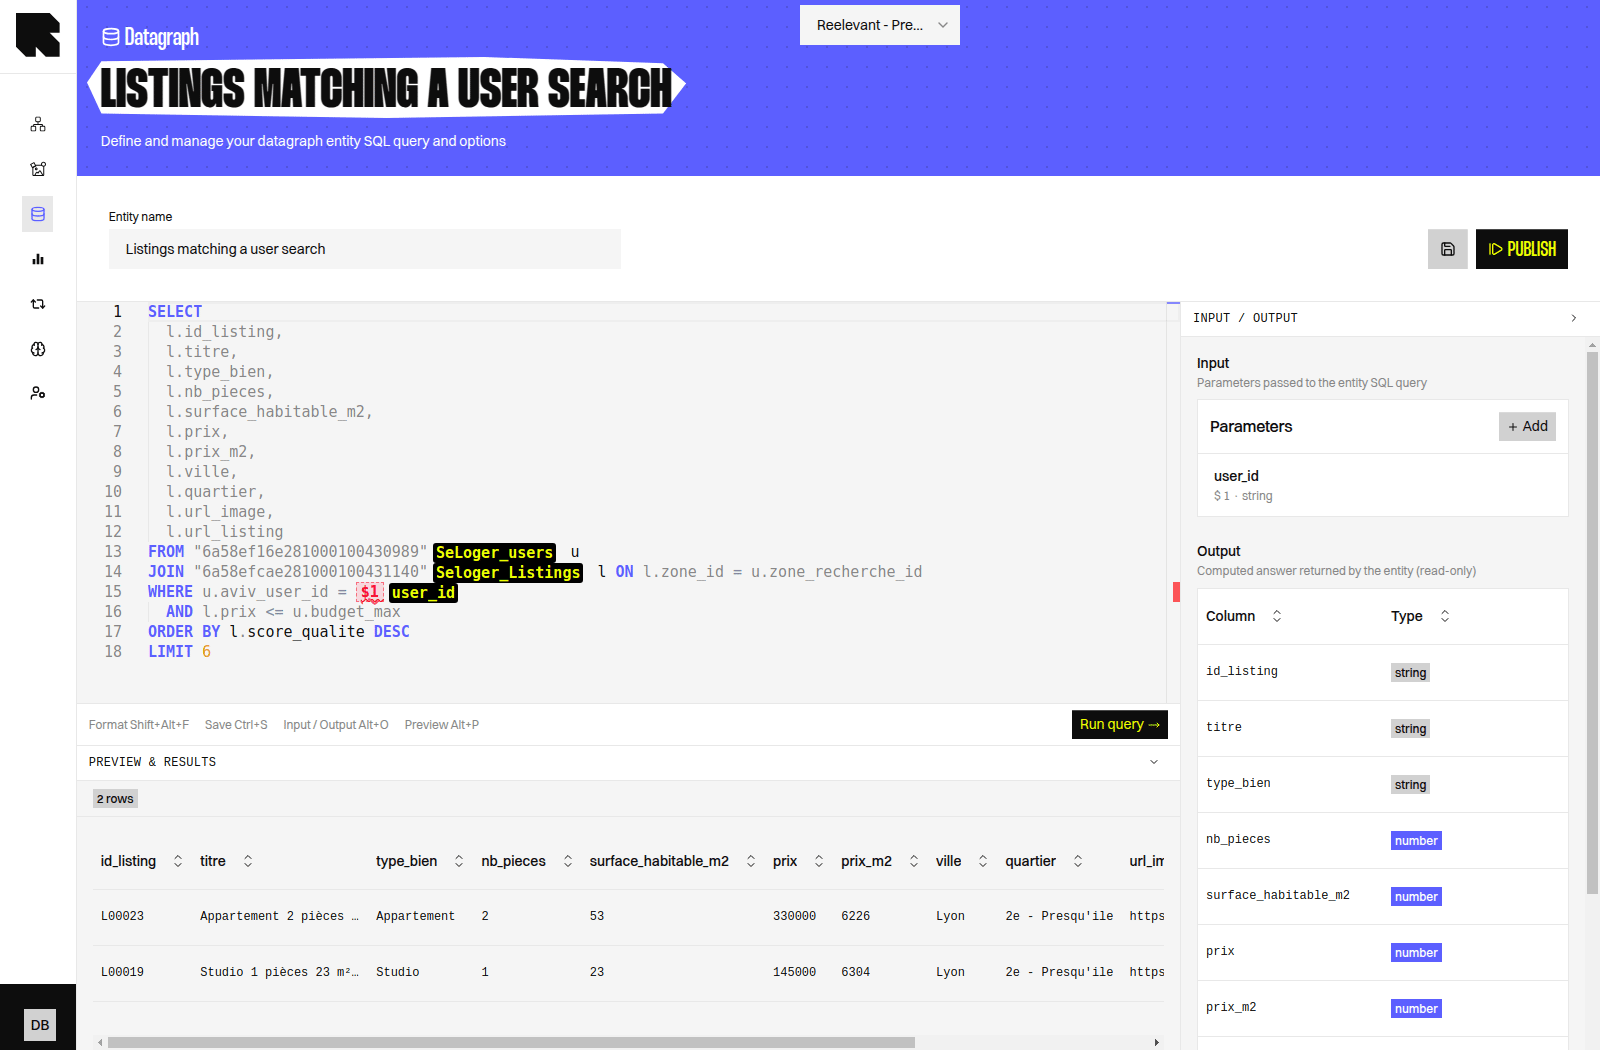
An Entity answers one question about one person, one product, or one area. Your data team writes it once, and every Workflow can reuse it. Here are typical examples for a property listings account:
The same patterns work for other businesses. A retail account might ask for the last items a person bought, the stock left in their favourite store, or the best sellers of their preferred category.
On an Entity page, the Preview & results panel shows a sample of the answer, so you can check the data before it goes live.
Using an Entity in a Workflow
Once an Entity is published, it can be used in a Workflow with the Query an entity Data Node (a Node that fetches external data for the Workflow).- Open your Workflow in the Workflow editor.
- Add the Query an entity Data Node.
- Select the published Entity you need.
- Fill in the Entity parameters, either with a fixed value or with a Workflow variable.
- Use the returned data in your Content or in a Condition.
Only users with the tech admin role can configure this Node. Ask your administrator if the Node appears read-only. See Permissions for the Datagraph Schema and Datagraph Entity permissions.
What’s Next?
DataHub Overview
Learn how Datasources are imported and configured.
Datagraph Deep Dive
Understand the data model, versions, and Entities in detail.
Explorer
Read a join match analysis and fix weak links.
Permissions
See who can view, edit, and publish Datagraph objects.