

Overview
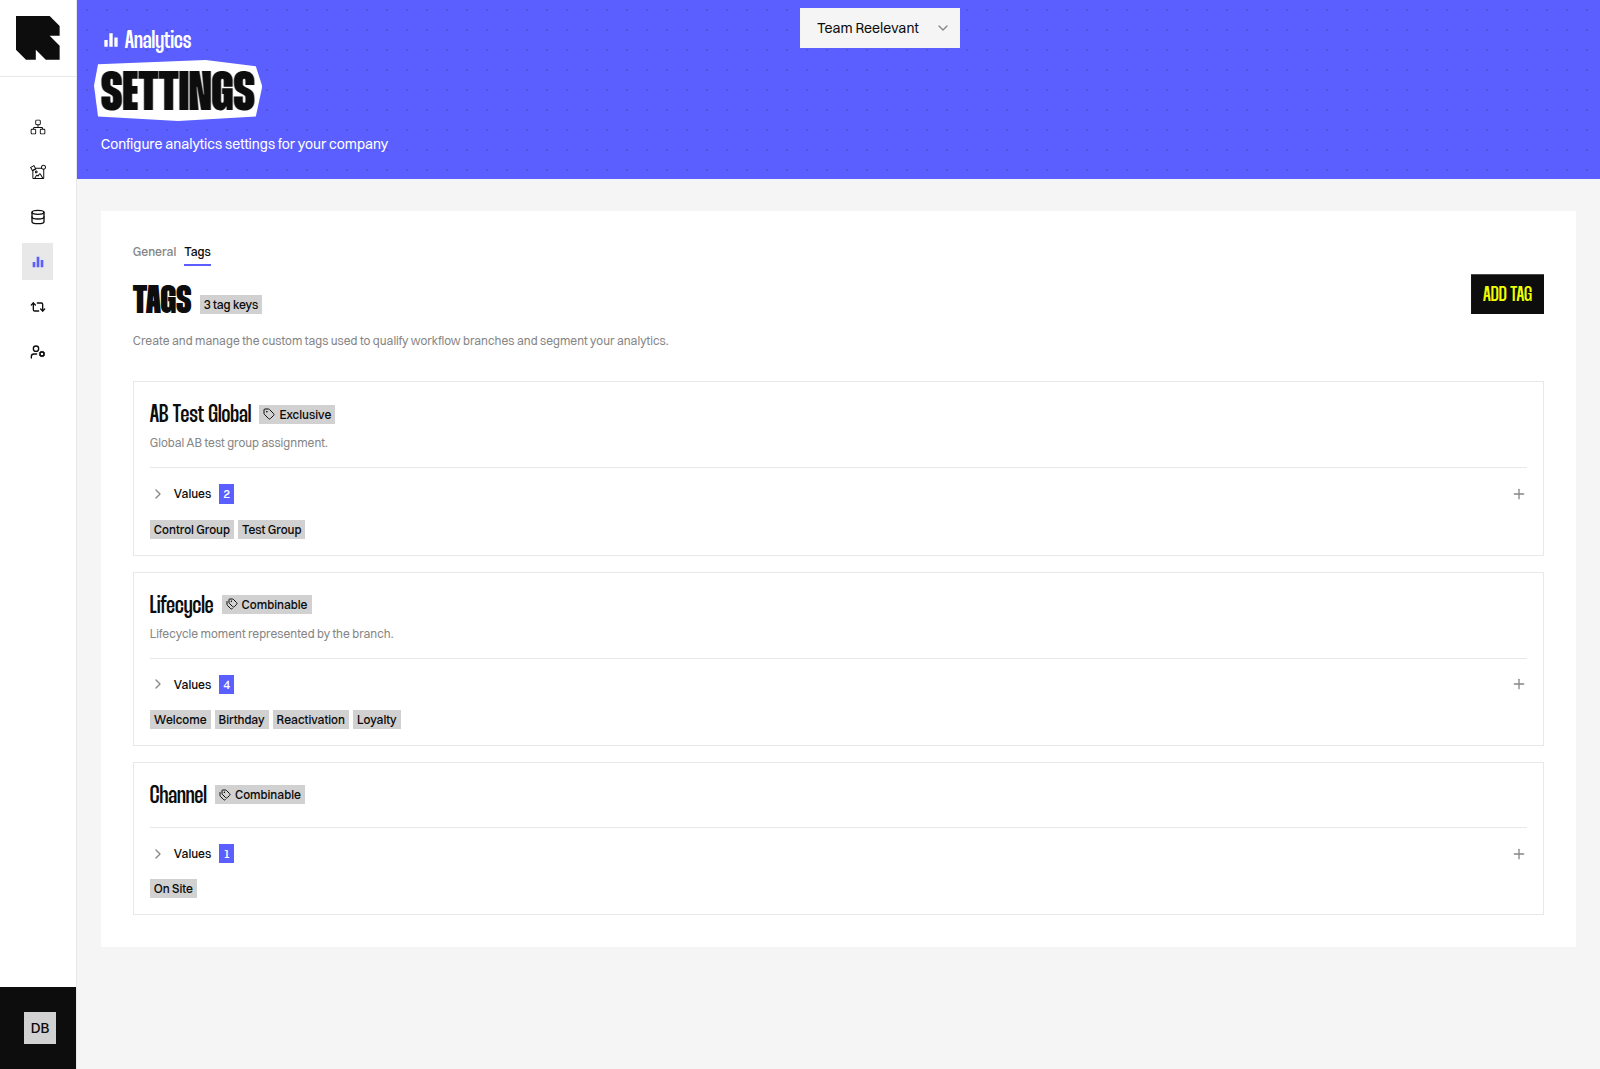
The Analytics Settings page lets you configure attribution, personalisation exposure, custom tags and branch categories for your company. Use tags and categories to qualify Branches and segment Analytics. Access it from the Settings link in the Analytics sidebar navigation.Attribution
Attribution decides how much revenue your Reelevant workflows helped generate. Here you choose the model, the lookback windows, and the data source. See Attribution for a full explanation.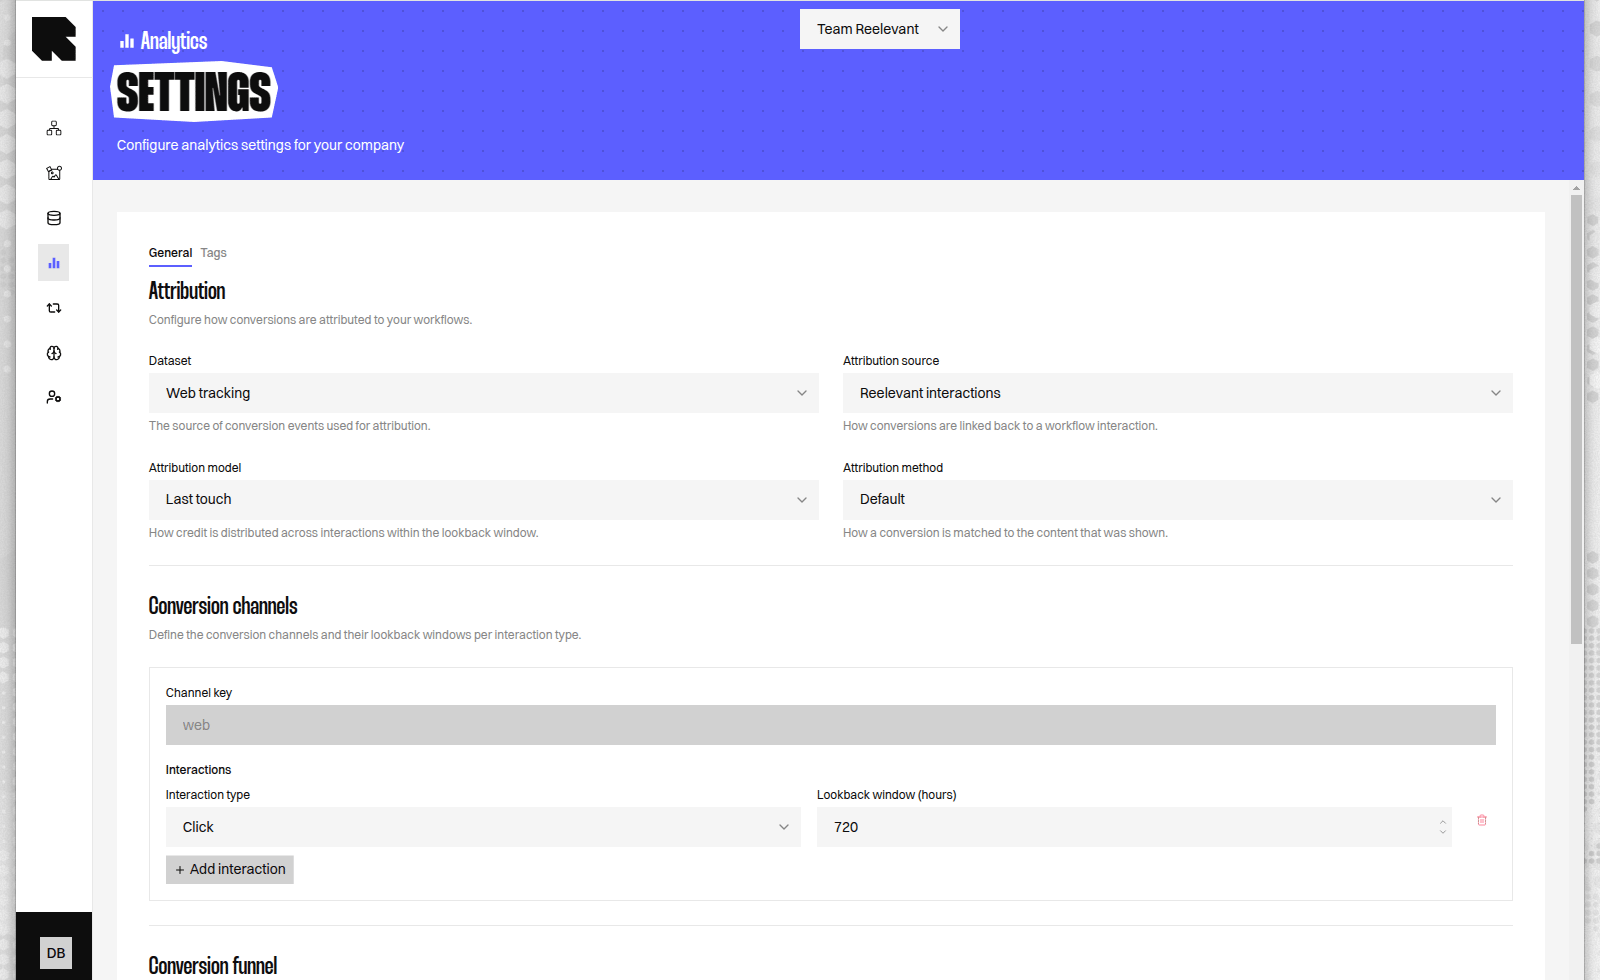
Attribution model
The model decides how credit is shared between the interactions that led to a purchase.Lookback windows
The lookback window is the time before a purchase during which an interaction can earn credit. You can set a different window for each interaction type.Configuring attribution
- Navigate to Analytics > Settings.
- Choose an attribution model.
- Set the lookback windows for each interaction type.
- Choose your data source (web tracking or customer purchases).
- Click Save.
Changing attribution affects how conversions are counted in the Conversions dashboard and Data Exploration. A longer window captures more conversions but may include less directly attributable purchases.
Personalisation exposure
These two thresholds decide which customers count as personalised in the Customer Impact dashboard. That dashboard and Adoption are both in beta and enabled on request, so you may not see them yet.
Customers above zero but below these thresholds count as neither personalised nor non-personalised. They stay out of the comparison.
- Navigate to Analytics > Settings.
- Scroll to Personalization exposure on the General tab.
- Set the two thresholds, or leave them empty to keep the defaults.
- Click Save changes.
Comparison reliability
This threshold decides when the Customer Impact dashboard shows an Uplift figure, and when it leaves it empty.
Both sides need that many customers: the personalised ones and the comparable non-personalised ones. Below it, the dashboard shows the customer counts but no figure.
An average over a handful of customers moves with a single basket. So an empty figure means “we cannot answer this”, not “no effect”.
- Navigate to Analytics > Settings.
- Scroll to Comparison reliability on the General tab.
- Set the threshold, or leave it empty to keep the default.
- Click Save changes.
Customer Impact also needs a period of at least one month. Over a shorter one, being reached by Reelevant and being active are almost the same thing. The dashboard opens on the last three months for that reason.
Tags
Tags give each Branch controlled labels that your team can use consistently across Workflows and Analytics. Each tag contains a tag key (the label to organise) and a list of values. For example,Campaign objective can contain Acquisition and Retention.
Only custom tags appear in this tab. Reelevant-managed tags are not editable.
Understand cardinality
Cardinality controls how many values from one tag key can be assigned to the same Branch. It does not limit how many values you create.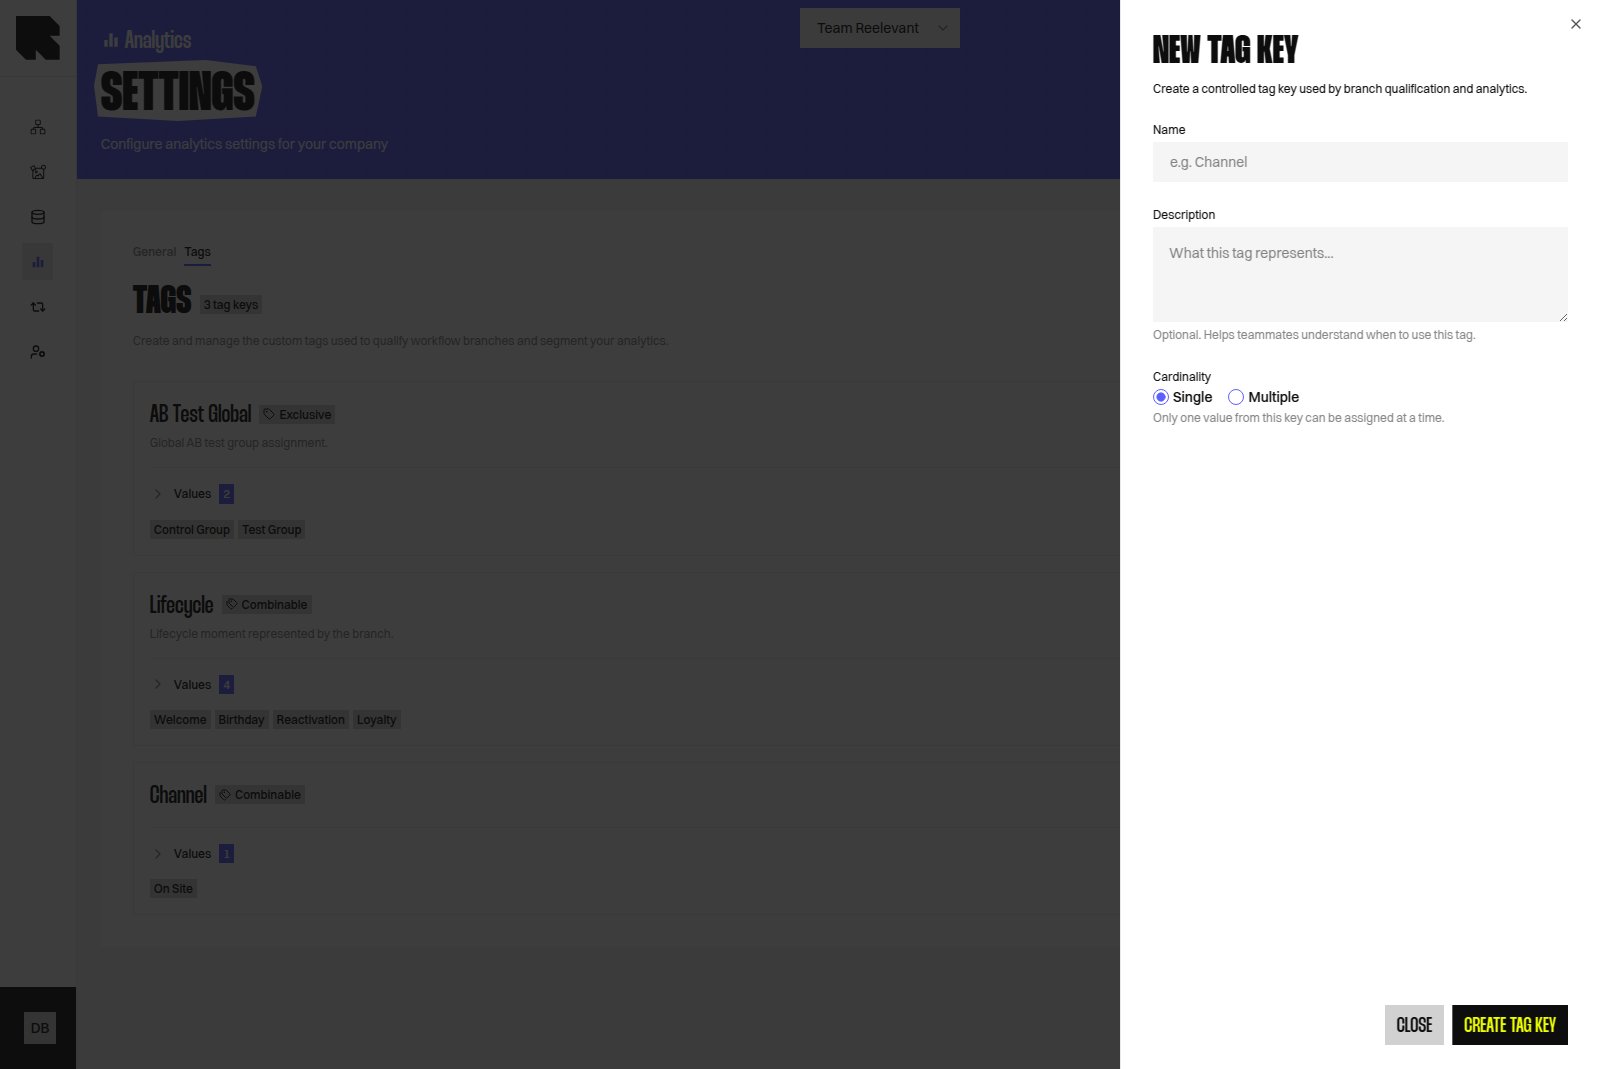
Most downstream means closest to the Output Node.
Imagine one Workflow qualifies
Campaign objective: Acquisition before a second Logic Node.
A later qualification on the same final Branch assigns Campaign objective: Retention. Analytics uses Retention because it is closer to the Output Node.
With Multiple cardinality, both values remain attached to the final Branch.
Create a tag key
- Navigate to Analytics > Settings.
- Select Tags.
- Click Add tag.
- Enter a unique Name.
- Add an optional Description to help teammates use the tag correctly.
- Choose Single or Multiple under Cardinality.
- Click Create tag key.
Add values
- Find the tag key.
- Click the plus icon beside Values.
- Enter a unique value name and an optional description.
- Click Add value.
Edit or delete tags
Use the pencil icon to change a tag key, its description, or its cardinality. Expand Values, then use each value’s action icons to edit or delete it.Use tags in Workflows and Analytics
Created tags become available when you qualify a Branch. Users select controlled values but cannot create new ones there. In Analytics, use tag keys and values to filter results or compare performance across your qualification choices.Branch categories
Viewing the category tree
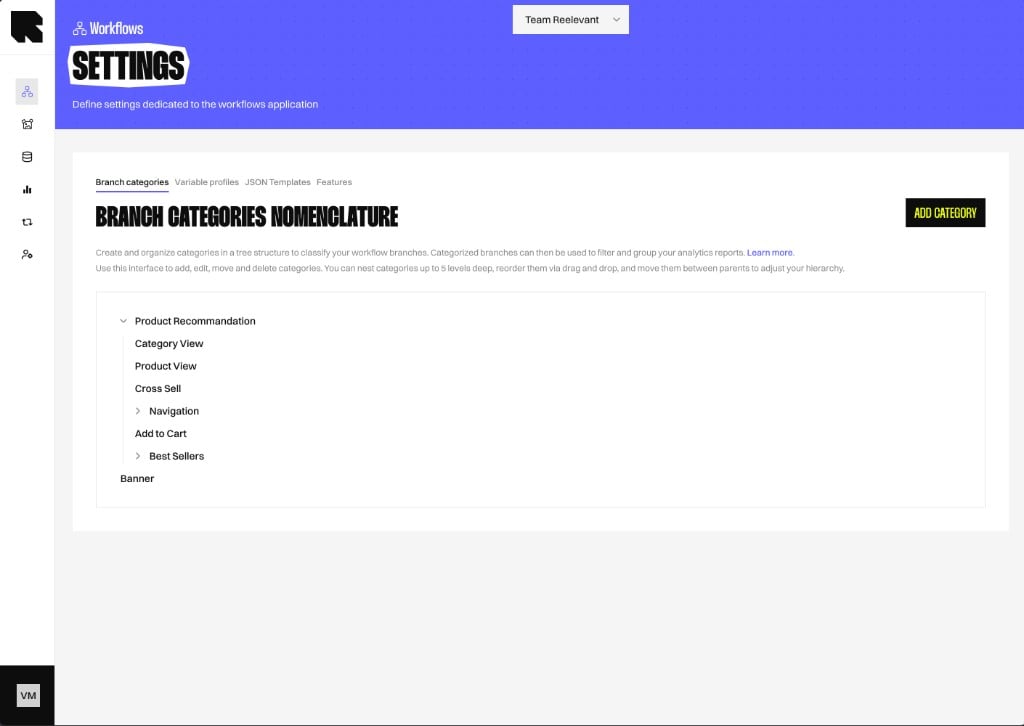
The tab displays your category tree as an interactive, expandable hierarchy. Each category shows:- Name — The category label.
- Level — Its depth in the tree.
- Children — Sub-categories nested underneath.
Creating a category
1
Open the form
Click the Add button to open the category creation drawer.
2
Fill in the details
- Name — A descriptive name for the category (e.g., “Product Recommendation”).
- Parent — Optionally select a parent category to nest this one underneath.
3
Save
Click Save to add the category to the tree.
Editing a category
Click on an existing category in the tree to open the edit drawer. You can update the name or move it under a different parent.Deleting a category
- Select the category in the tree.
- Click the Delete button.
- Confirm the deletion in the confirmation modal.
Best practices
- Design for analytics — Structure your category tree around the dimensions you want to analyse (e.g., by strategy type, by content category, by audience segment).
- Keep it flat enough — A deep tree is harder to navigate. Aim for 2-3 levels at most.
- Name clearly — Use descriptive names that any team member can understand without context.
What’s Next?
Branches
Assign your controlled tag values while qualifying Branches.
Data Exploration
Filter and compare performance with your tag keys.
Attribution
Understand how Reelevant credits revenue to content interactions.