Overview
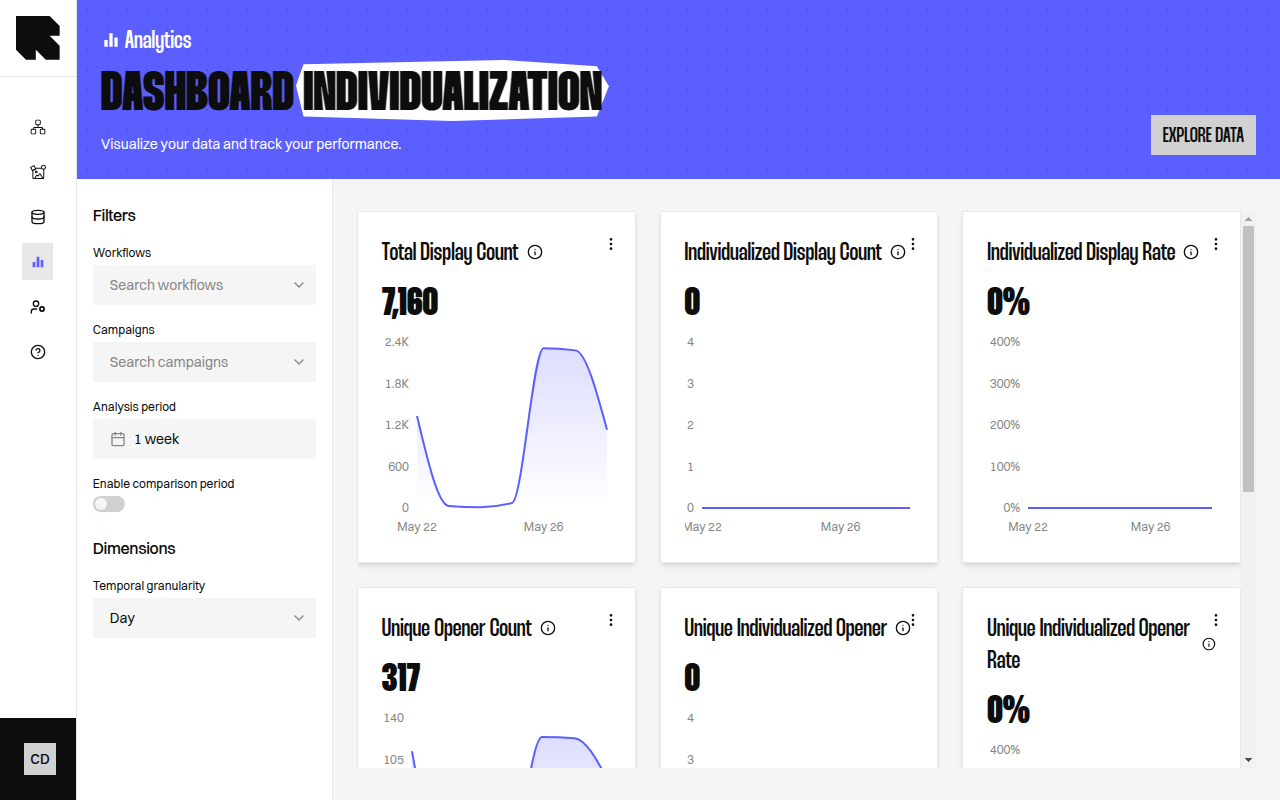
The Individualization dashboard measures how much of your content delivery is personalized. It compares individualized content (delivered through personalized workflow branches) against default content (non-personalized fallbacks).Key Metrics
| Metric | Description |
|---|---|
| Individualized Opening Count | Number of openers that have seen at least one individualized content. |
| Individualized Display Count | Number of individualized content displays. A content is considered individualized if it results from browsing interactions. |
| Individualized Display Rate | Share of individualized contents among all content displays. |
| Unique Individualized Opener | Number of unique openers who saw individualized content. |
| Unique Individualized Opener Rate | Ratio between individualized openers and total openers. |
Individualized Content vs Default
The dashboard includes a comparison table showing side-by-side metrics for:| Type | Description |
|---|---|
| Individualized | Content delivered through personalized workflow branches. |
| Default | Content delivered through non-personalized fallback branches. |
| Total | Combined metrics across both types. |
To increase your individualization rate, add more personalized branches to your workflows using data nodes and conditions.