Overview
The Performance dashboard provides a high-level view of how your workflows are performing in terms of content delivery and user engagement.Key Metrics
| Metric | Description |
|---|---|
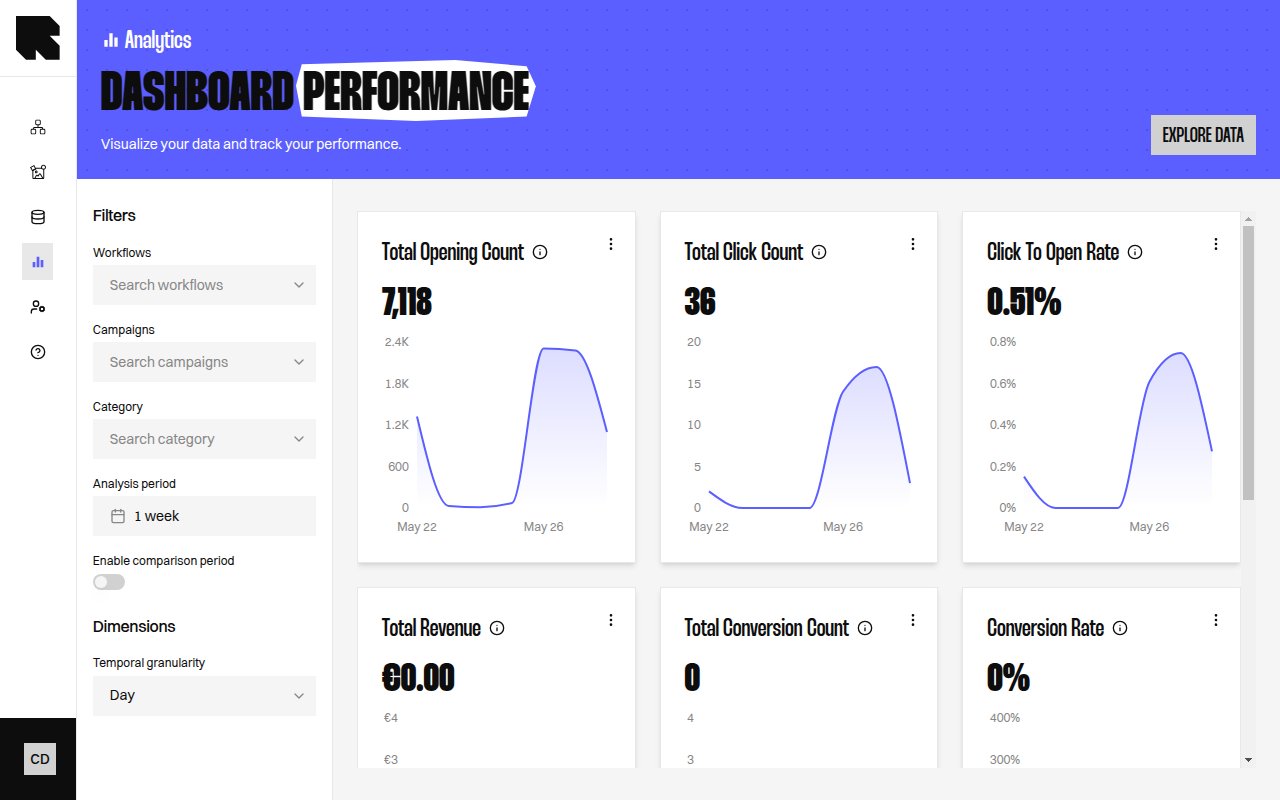
| Total Display Count | Number of Reelevant contents that have been displayed. |
| Total Click Count | Number of clicks on Reelevant contents. |
| Click To Open Rate | Ratio of all clicks to total openings. |
| Average Content Generation Duration | Average time to generate and display a visual. |
How to Read This Dashboard
- Total Display Count tells you how many times your content was shown to users.
- Total Click Count measures direct engagement with your content.
- Click To Open Rate (CTOR) indicates how compelling your content is — higher is better.
- Average Content Generation Duration helps monitor rendering performance.