Overview
The Audience & Interactions dashboard focuses on the people behind the numbers — how many unique users see and interact with your content, and how engaged they are.Key Metrics
| Metric | Description |
|---|---|
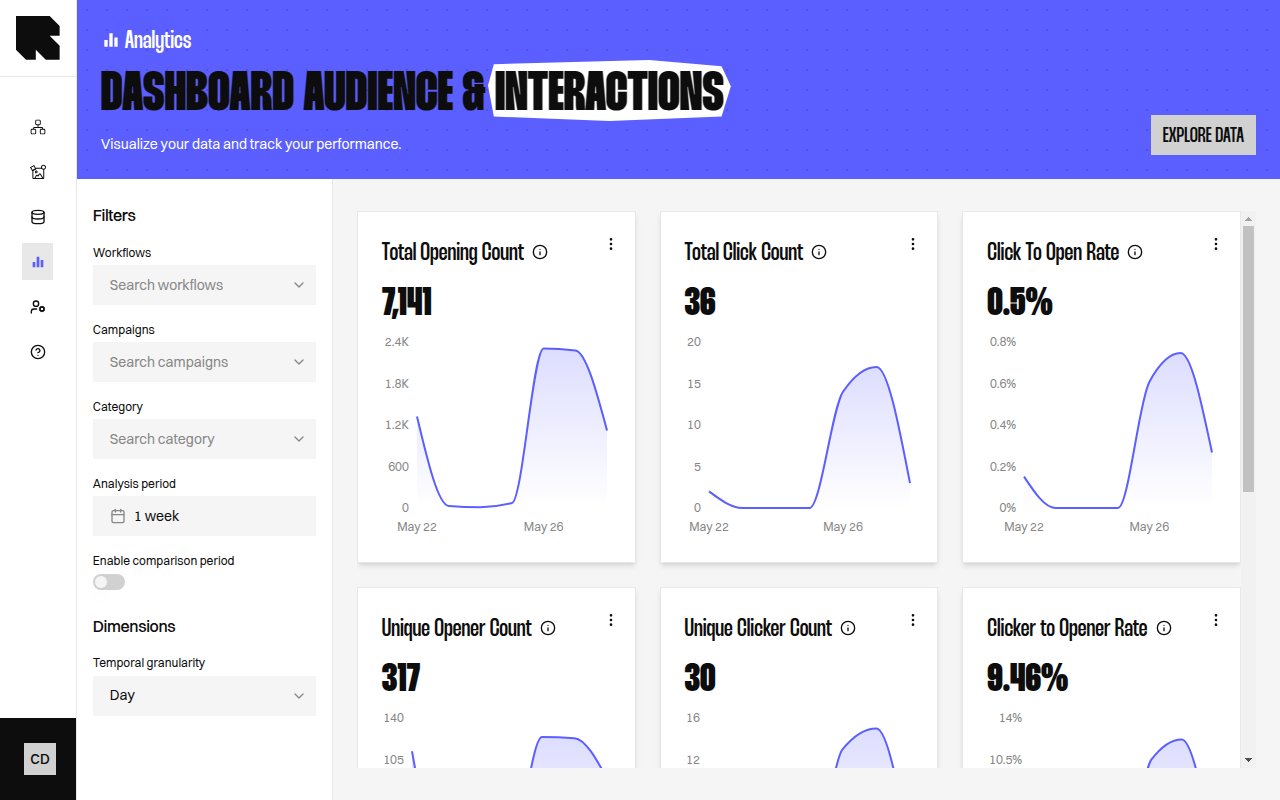
| Unique Opener Count | Number of unique users who opened content containing Reelevant visuals. |
| Total Opening Count | Number of openings containing at least one Reelevant visual. |
| Repeat Content Exposition Per User | Average number of openings per opener. |
| Unique Clicker Count | Number of unique people that interacted with Reelevant contents. |
| Average Click Per User | Number of times the same person clicks, on average. |
| Clicker to Opener Rate | Ratio of unique clickers to unique openers. |
How to Read This Dashboard
- Unique Opener Count vs. Total Opening Count — The gap between these shows how many repeat exposures your audience receives.
- Repeat Content Exposition Per User — A higher value means users are seeing your content multiple times, which can indicate either good retargeting or potential fatigue.
- Clicker to Opener Rate — This is your per-person engagement rate. Unlike Click To Open Rate (which counts events), this counts unique people.