Overview
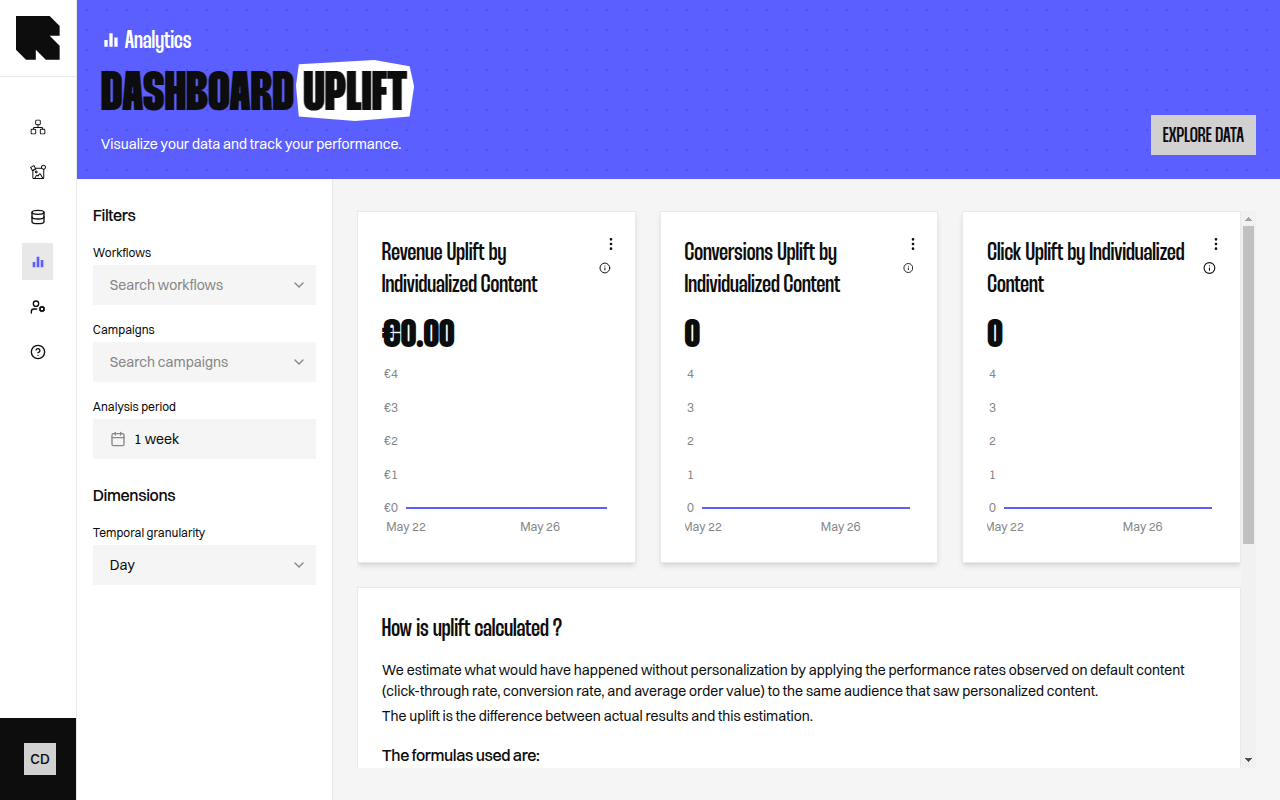
The Uplift dashboard measures the incremental value that personalization brings compared to what would have happened with only default (non-personalized) content. It answers the question: “How much additional value did individualization generate?”Key Metrics
| Metric | Description |
|---|---|
| Click Uplift by Individualized Content | Additional clicks generated by personalization — clicks minus what only default contents would have brought. |
| Conversions Uplift by Individualized Content | Additional conversions minus those that would have occurred with only default content. |
| Revenue Uplift by Individualized Content | Additional revenue minus what default content would have generated. |
Uplift Breakdown
The dashboard includes a breakdown table comparing actual results against an “Without individualization” estimation row:| Column | Description |
|---|---|
| Type | Individualized, Default, or Total. |
| Metrics | The actual measured values for each type. |
| Without individualization | Estimated values if no personalization had been applied. |
How is Uplift Calculated?
The platform estimates what would have happened without personalization by applying the performance rates observed on default content to the same audience that saw personalized content:| Formula | Calculation |
|---|---|
| Estimated clicks | Click-through rate (default) × Impressions (personalized) |
| Estimated conversions | Conversion rate (default) × Estimated clicks |
| Estimated revenue | Average order value (default) × Estimated conversions |
Uplift calculations require sufficient data in both individualized and default branches. If your workflows have very low traffic on default branches, the estimation may be less reliable.